Hello, friends! 👋
I'm excited to welcome you back to another insightful analysis. Today, we're analyzing Amazon, the e-commerce and cloud giant.
If you missed my previous articles, you can catch up on them here:
If you haven't already, consider following me for more FREE content to enhance your investment journey. Whether you're a beginner or an advanced investor, you'll find valuable insights to help you make informed decisions. 😊
Table of contents
Corporate Analysis
1.1 Business Overview
1.2 Revenue BreakdownExecutive Leadership
2.1 CEO Experience
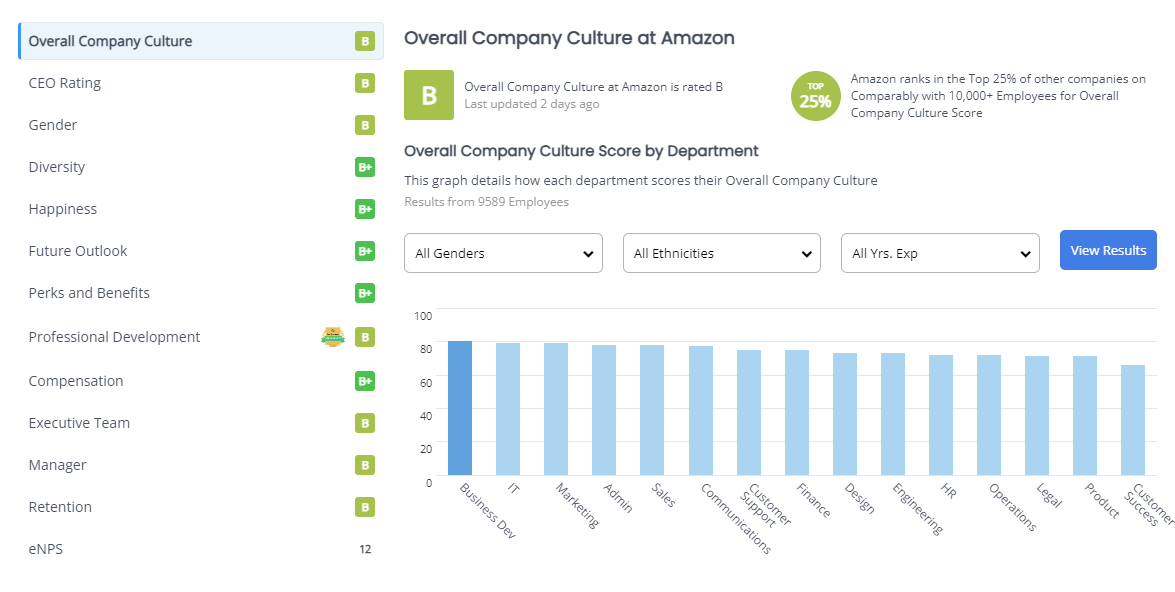
2.2 Employee Satisfaction Ratings
2.3 CEO Value CreationCompetitive and Sustainable Advantages (MOAT)
Industry Analysis
4.1 Current Industry Landscape and Growth Prospects
4.2 Competitive LandscapeRisk Assessment
Financial Stability
6.1 Asset Evaluation
6.2 Liability AssessmentCapital Structure
7.1 Expense Analysis
7.2 Capital Efficiency ReviewProfitability Assessment
8.1 Profitability, Sustainability, and Margins
8.2 Cash Flow AnalysisGrowth Analysis
9.1 Historical Growth Trends
9.2 Future Growth ProjectionsValue Proposition
10.1 Dividend Analysis
10.2 Share Repurchase Programs
10.3 Debt Reduction StrategiesFuture Outlook
Quality Rating
SWOT Analysis
Valuation Assessment
Conclusion
1. Corporate Analysis
1.1 Business Overview
Amazon.com, Inc. sells consumer products and subscriptions through online and physical stores in North America and internationally. The company operates through three segments: North America, International, and Amazon Web Services (AWS).
Its products offered through its stores include merchandise and content purchased for resale and products offered by third-party sellers. The company also manufactures and sells electronic devices, including Kindle, Fire tablets, Fire TVs, Rings, Blink, eero, and Echo, and develops and produces media content. In addition, it offers programs that enable sellers to sell their products in its stores and programs that allow authors, musicians, filmmakers, Twitch streamers, skill and app developers, and others to publish and sell content.
Further, the company provides computing, storage, databases, analytics, machine learning, other services, fulfillment, advertising, and digital content subscriptions. Additionally, it offers Amazon Prime a membership program.
The company serves consumers, sellers, developers, enterprises, content creators, and advertisers. Amazon.com, Inc. was incorporated in 1994 and is headquartered in Seattle, Washington.
1.2 Revenue Breakdown
Amazon’s primary revenue drivers are as follows:
Online Stores Revenue:
Description: Revenue generated from product sales through Amazon's online platform, which includes various categories such as electronics, clothing, and household goods.
Products: Direct sales of products on Amazon.com and other international Amazon websites.
AWS Revenue:
Description: Revenue from Amazon Web Services (AWS), which provides cloud computing services, including computing power, storage, and databases for businesses and developers.
Products: EC2 (Elastic Compute Cloud), S3 (Simple Storage Service), RDS (Relational Database Service), Lambda, and other AWS offerings.
Subscription Services Revenue:
Description: Revenue from subscription-based services, offering customers ongoing access to digital content and membership benefits.
Products: Amazon Prime memberships, Prime Video, Amazon Music, Kindle Unlimited, and Audible subscriptions.
Advertising Services Revenue:
Description: Revenue from advertising services that allow sellers, vendors, publishers, and authors to reach Amazon customers through targeted ads.
Products: Sponsored Products, Brands, Sponsored Displays, Amazon DSP (Demand-Side Platform).
Third-Party Sellers Revenue:
Description: Revenue generated from fees and commissions charged to third-party sellers who list and sell their products on Amazon's marketplace.
Products: Referral fees, fulfillment fees, and account service fees for sellers using Amazon's platform.
Physical Stores Revenue:
Description: Revenue from Amazon's physical retail stores, including Whole Foods Market and Amazon-branded stores, offering a range of grocery and non-grocery items.
Products: Sales from Whole Foods Market, Amazon Go, Amazon Fresh, and other Amazon physical retail locations.
As of 2023, Amazon had a Total Revenue of 574,785M.
Online Stores Revenue generated $231,872M, accounting for 40.34% of Amazon’s Total Revenue
Physical Stores Revenue generated $$20,030M, accounting for 3.48% of Amazon’s Total Revenue
Third-party seller Revenue generated $140,053M, accounting for 24.37% of Amazon’s Total Revenue
Advertising Services generated $46,906M, accounting for Revenue 8.16% of Amazon’s Total Revenue
Subscription Services Revenue generated $40,209M, accounting for 7.00% of Amazon’s Total Revenue
AWS Revenue generated $90,757M, accounting for 15.79% of Amazon’s Total Revenue
Other Segments Revenue generated $4,958M, accounting for 0.86% of Amazon’s Total Revenue
Many investors, like myself, argue that Amazon is like an index itself due to the significant types of pools through which it generates revenue. I am a big fan of businesses with multiple pools, which generate returns for the business. When a downturn occurs and a pool comes under fire, there are enough other pools to act as a safety net to avoid significant losses. Of course, over-diversification can be damaging, but Amazon found its sweet spot here. These pools are managed correctly and seem to boost Amazon’s sales adequately with less risk.
(Click on the photo for a better view)
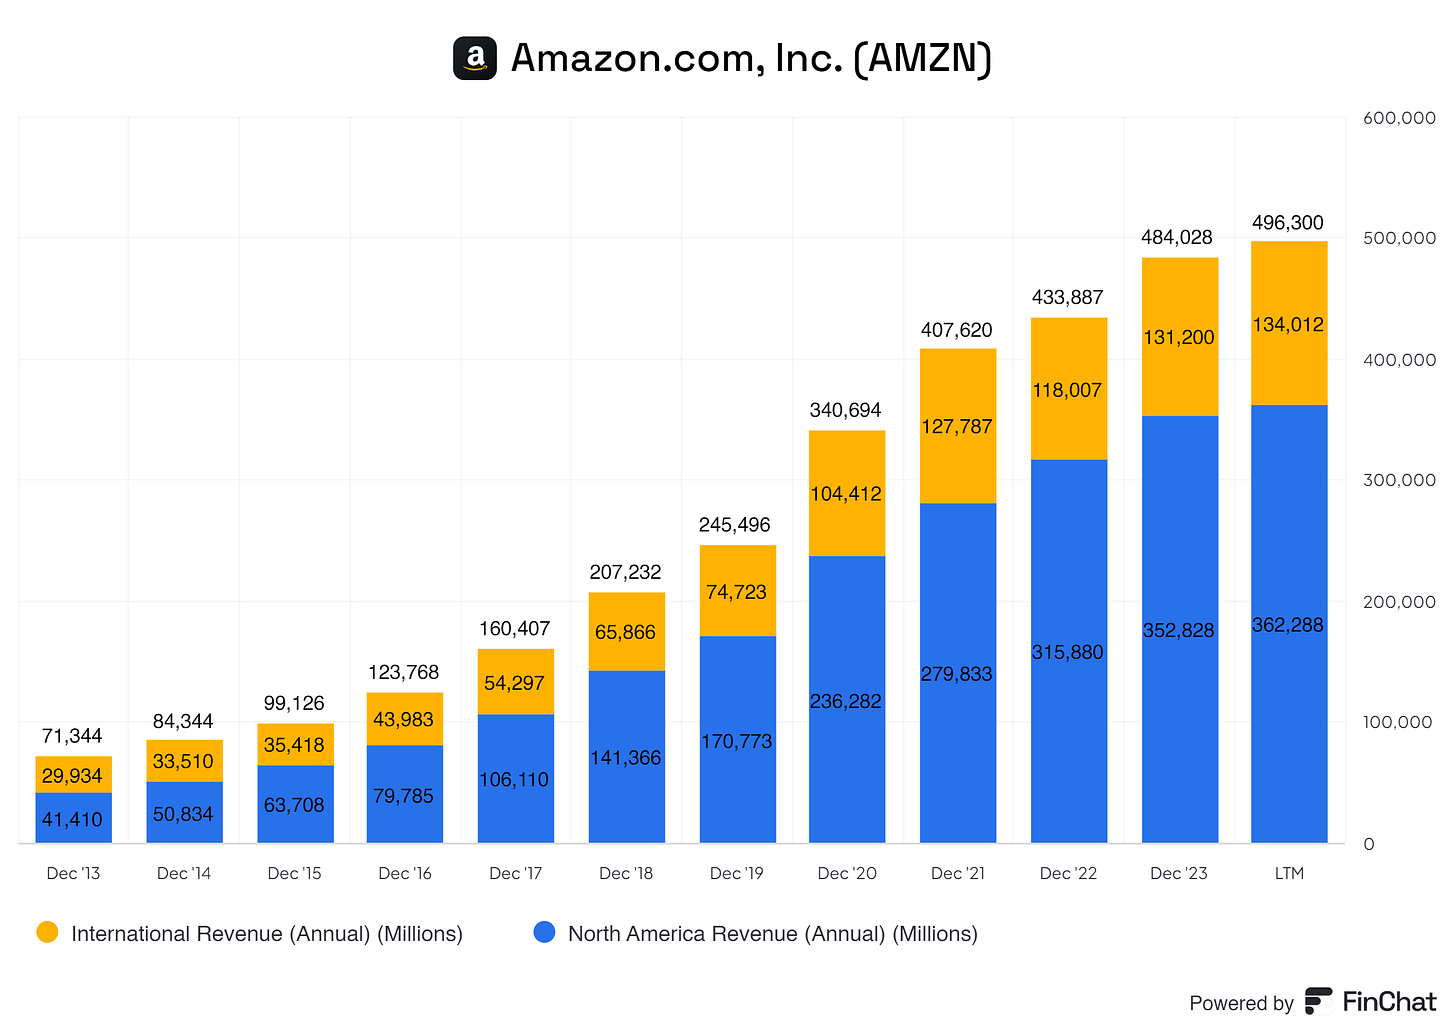
Talking about diversification, let us see how diversified Amazon is globally.
Right off the bat, we see that Amazon gets most of its revenue from its non-America region, which includes the United States, Canada, Mexico, Bermuda, Greenland, Saint Pierre, and Miquelon.
Of its physical sales, 53,47% come from the North American region, and 19.98% of its physical sales come from Europe and the remaining countries. AWS in this story is 13.56%; this is reported as AWS and not per region, unfortunately. We do see significant increases in Amazon's international sales. This shows that Amazon is efficiently expanding its operations outside the American region. This is a positive sign, as we discussed during the revenue breakdown. We want businesses that operate globally to ensure that we, investors, and the business have a safety net. This ensures that if a country starts regulating more or puts pressure on businesses, the business can still generate revenues from other regions. This way, the business ensures that a massive drop in revenues becomes less likely, which is very positive!
(Click on the photo for a better view)
2. Executive Leadership
2.1 CEO Experience
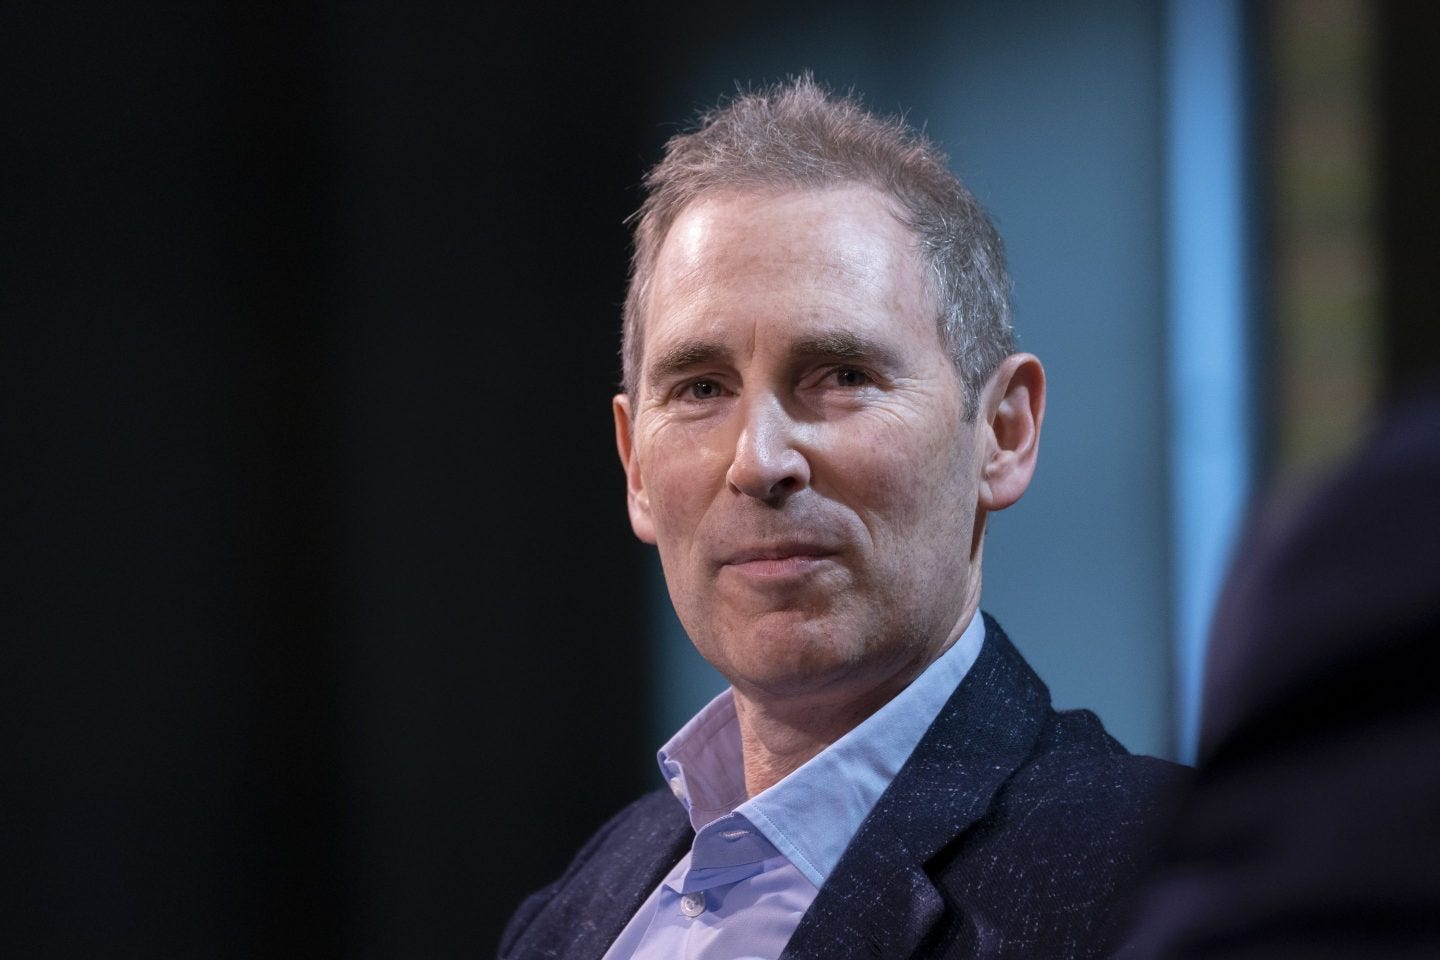
Andrew Jassy has been the CEO of Amazon since July 2021, replacing the world-famous entrepreneur Jeff Bezos.
Andrew Jassy has been with Amazon since 1997 as CEO of the Amazon Web Services Department, AWS. Andrew Jassy has done this for 24+ years. In 2021, Jeff Bezos contacted Jassy, and the rest is history. Andrew Jessy has 27+ years of experience with Amazon. Andrew Jassy joined Amazon as soon as he left Harvard Business School; only after five years with Amazon did Andrew Jassy become a ‘‘shadow’’ advisor for Jeff Bezoss and sit in on the CEO’s meetings, including one-n-ones.
Andrew Jassy owns about 2,100,748 Amazon.com Inc (AMZN) shares worth over $393 Million, accounting for 0.01985% of the total outstanding shares. Andrew Jassy only owns Amazon shares.
2.2 Employee Satisfaction Ratings
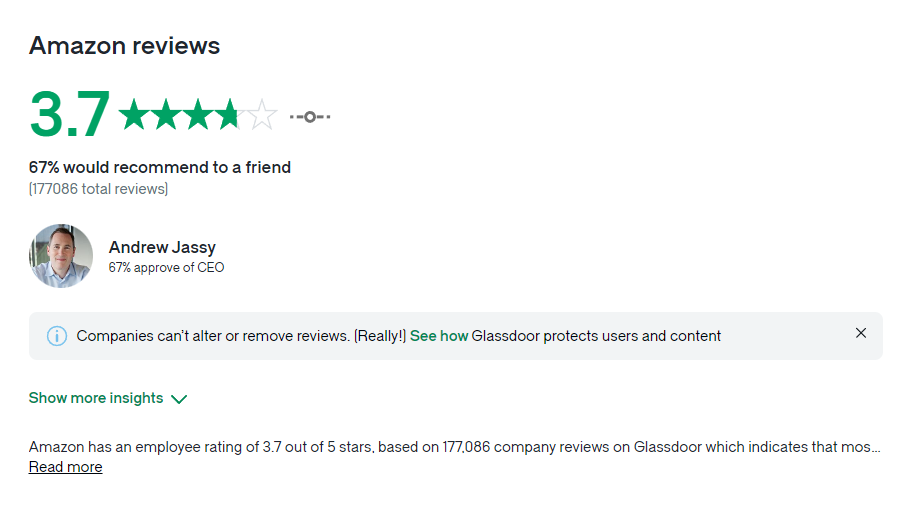
Amazon is one of the biggest businesses globally. It surprised me that Andrew Jassy scored so well here, chapeau!
Again, the same is true here; overall, it is a solid score for Amazon.
Amazon is one of the biggest businesses globally. Therefore, we expect more unsatisfied employees and more room for improvement. This score tells us that even with its size, amazon still manages to put its employees high on the list, as reflected in the scores. I expected far lower scores for Amazon. With these types of businesses, management, and higher-ups can quickly forget to check in with employees, manage everybody accordingly, handle issues quickly, and more. This is a issue that happens when a business scales, there more to keep track of and it seems like Amazon is doing this rather well if I look at the scores!
Hats off to Amazon here!
2.3 CEO Value Creation
Does Andrew Jassy create value for its shareholders, though?
That’s a solid YES!
in 2021, Andrew Jassy took over; from here, we see that there are no significant changes on all three metrics, indicating that Andrew Jassy is keeping up with what Jeff Bezos left behind; this is extremely impressive!
3. Competitive and Sustainable Advantage (MOAT)
So, a MOAT can be in either one or more of the following forms:
Brand Power
Patents
Scale and Cost Advantages
Switching Costs
Network Effect
Attracting Talent (I consider this a MOAT, others don’t. Decide for yourself)
Brand Power
Amazon is a global leader in e-commerce and cloud computing. Its brand is synonymous with convenience, competitive pricing, and a vast product selection. Known for its customer-centric approach, Amazon consistently ranks high in customer satisfaction and brand loyalty. The company’s strong reputation as a reliable and innovative service provider makes it a preferred choice for millions of customers worldwide.
Patents
Amazon holds an extensive portfolio of patents covering various technologies, including logistics, cloud computing, and artificial intelligence. These patents protect Amazon's intellectual property and give the company a competitive edge by safeguarding its innovative solutions, such as its proprietary algorithms for recommendation systems and advanced warehouse automation technologies.
Scale and Cost Advantages
Amazon’s massive scale provides significant cost advantages. With its global supply chain network, extensive infrastructure, and vast customer base, Amazon can negotiate favorable terms with suppliers and achieve economies of scale. This enables the company to offer competitive prices while maintaining profitability. Additionally, Amazon's scale allows for substantial investment in research and development, ensuring continuous innovation and market leadership.
Switching Costs
Amazon’s ecosystem creates high switching costs for both customers and businesses. Services like Amazon Prime offer fast shipping, streaming content, and exclusive deals, creating a seamless experience that is difficult to replicate. For businesses, Amazon Web Services (AWS) offers deeply integrated cloud solutions, making the transition to other platforms challenging due to time, cost, and integration complexities. These factors contribute to strong customer and business retention.
Network Effect
Amazon benefits from a powerful network effect. As more sellers and buyers join its marketplace, the platform becomes more valuable to both parties. This self-reinforcing cycle attracts more third-party sellers, enhancing product diversity and driving more customers to the platform. The network effect extends to AWS, where many businesses and developers contribute to a robust ecosystem, further enhancing Amazon's value proposition.
Attracting Talent
Amazon is known for attracting top talent from across the globe. Its culture of innovation, competitive compensation, and opportunities for career growth make it a highly desirable employer in the tech industry. Amazon's commitment to continuous learning and development and its emphasis on diversity and inclusion fosters a dynamic and innovative work environment. This influx of skilled employees drives further innovation, ensuring Amazon maintains its competitive advantage.
4. Industry Analysis
4.1 Current Industry Landscape and Growth Prospects
Amazon operates in e-commerce and cloud computing. Therefore, this analysis will focus on these two.
E-commerce’s market size was roughly estimated to be 25.93 trillion; yes, you read that right, 25.93 trillion USD in 2023. Although it is already a massive market, there’s explosive growth on the horizon; more on why later. E-commerce is estimated to grow with a CAGR of 19% up to 2030, which is explosive for Amazon. This growth came from a significant consumer shift from in-person to online shopping. Online shopping is becoming increasingly more accessible for everybody, regardless of location. In addition, time constraints boost this even further. People have less time these days, and needing efficiency is crucial. Via online shopping you save tremendous amounts of time, time is scarce these days for many.
Moreover, advancements in encryption technology and secure payment gateways have bolstered customer confidence, encouraging the growth of electronic transactions. Social media platforms have also significantly impacted online shopping by providing businesses powerful marketing tools. These platforms enable companies to engage with their target audience, showcase products, and drive traffic to their e-commerce sites.
In 2023, the global cloud computing market was valued at approximately USD 602.31 billion and is projected to expand at a compound annual growth rate (CAGR) of 21.2% from 2024 to 2030. Several key factors drive this rapid growth. Large enterprises are increasingly recognizing the transformative benefits of cloud computing, such as streamlined operations, enhanced agility, and increased efficiency, which significantly improve organizational performance. Additionally, the emergence of hybrid and multi-cloud solutions offers businesses the flexibility and control they desire, allowing them to utilize the strengths of various cloud providers and tailor their infrastructure to meet specific needs. Moreover, adopting pay-as-you-go pricing models eliminates the need for substantial upfront investments typically associated with traditional IT infrastructure, making cloud computing an appealing option for businesses of all sizes. This trend is especially evident in developing countries, where companies are eager to enhance their digital capabilities and compete globally.
4.2 Competitive Landscape
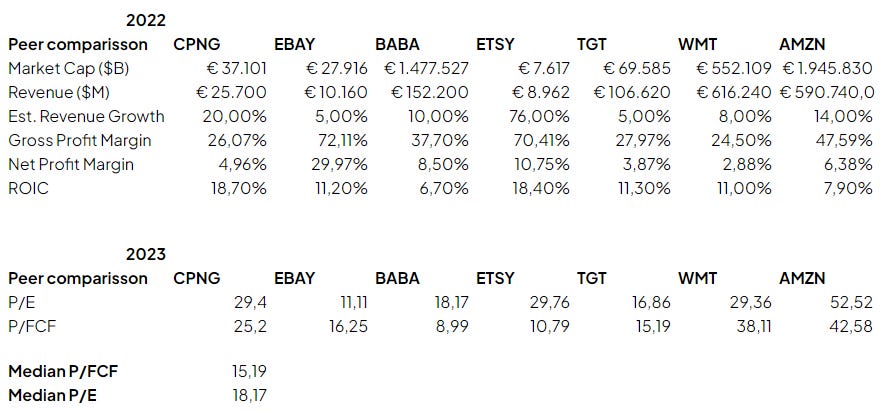
I identify Amazon's competitors/peers as Coupand, eBay, Alibaba, Etsy, Target, and Walmart.
(Click on the photo for a better view)
Amazon (AMZN) is a dominant player in both the e-commerce and cloud computing markets, competing against significant companies such as Coupang (CPNG), eBay (EBAY), Alibaba (BABA), Etsy (ETSY), Target (TGT), and Walmart (WMT). In 2022, Amazon led in market capitalization, valued at €1,945.830 billion, and boasted a substantial revenue of €590,740 million. This places Amazon ahead of Walmart, with a market cap of €552.109 billion and revenue of €616,240 million, significantly surpassing other competitors in market size and financial performance.
Amazon's revenue growth rate of 14.00% in 2022 outpaced traditional retail giants like Target (5.00%) and Walmart (8.00%). However, Etsy stands out with an impressive growth rate of 76.00%, indicating strong demand in niche markets. Alibaba and Coupang also demonstrate notable growth rates of 10.00% and 20.00%, respectively, reflecting their expanding market presence.
Regarding gross profit margin, Amazon's margin of 47.59% positions it favorably against competitors, though it trails eBay's leading margin of 72.11% and Etsy's 70.41%. These margins highlight Amazon's ability to scale its operations and maintain competitive pricing efficiently. Nevertheless, Amazon's robust margins contribute significantly to its competitive advantage.
Amazon faces challenges in net profit margins when compared to certain industry players. In 2022, Amazon's net profit margin was 6.38%, lower than eBay's 29.97% and Etsy's 10.75%. Improving its net profit margin would enhance Amazon's competitive positioning, particularly as it navigates a rapidly evolving market landscape.
Amazon's Return on Invested Capital (ROIC) of 7.90% suggests room for improvement compared to its peers. Etsy and Coupang have higher ROICs at 18.40% and 18.70%, respectively, indicating more efficient capital utilization. Amazon should enhance capital efficiency to match or exceed competitors in this metric.
For 2023, Amazon's Price-to-Earnings (P/E) ratio stands at 52.52, significantly higher than competitors like eBay (11.11) and Target (16.86). This high P/E ratio reflects strong investor confidence in Amazon's future earnings potential but also highlights the importance of maintaining robust growth to justify such valuations.
Amazon's Price-to-Free Cash Flow (P/FCF) ratio is 42.58, above the median P/FCF ratio of 15.19. While this indicates positive expectations, Amazon should continue focusing on converting revenue growth into free cash flow to remain attractive to investors.
Amazon excels in market capitalization and revenue, showcasing its dominant position in the e-commerce and cloud computing sectors. However, it faces challenges in net profit margins and ROIC, which it must address to strengthen its competitive edge. Despite these challenges, Amazon's robust growth rates and gross profit margins underscore its market demand and effective business model. To maintain its leadership, Amazon should improve profitability and capital efficiency, ensuring sustained growth and investor confidence.
Pssssst! If you like my content, consider sharing it with your friends or family.
5. Risk Assessment
Regulatory risks
Amazon's operations are subject to various regulations and compliance requirements in different countries. Changes in laws, regulations, or government policies, including tax laws, trade restrictions, and data protection regulations, could adversely affect Amazon's business.
Legal and Compliance Risks
The company faces risks from potential legal actions and regulatory investigations. These can include claims related to intellectual property infringement, competition law violations, and other legal issues.
Intense Competition
Amazon operates in highly competitive markets across various industries, including retail, cloud computing, digital content, and more. Competitors range from large, well-established companies with significant resources to small, nimble startups. This intense competition can lead to pricing pressures, reduced profit margins, and the potential loss of market share.
6. Financial Health
6.1 Assets Assessment
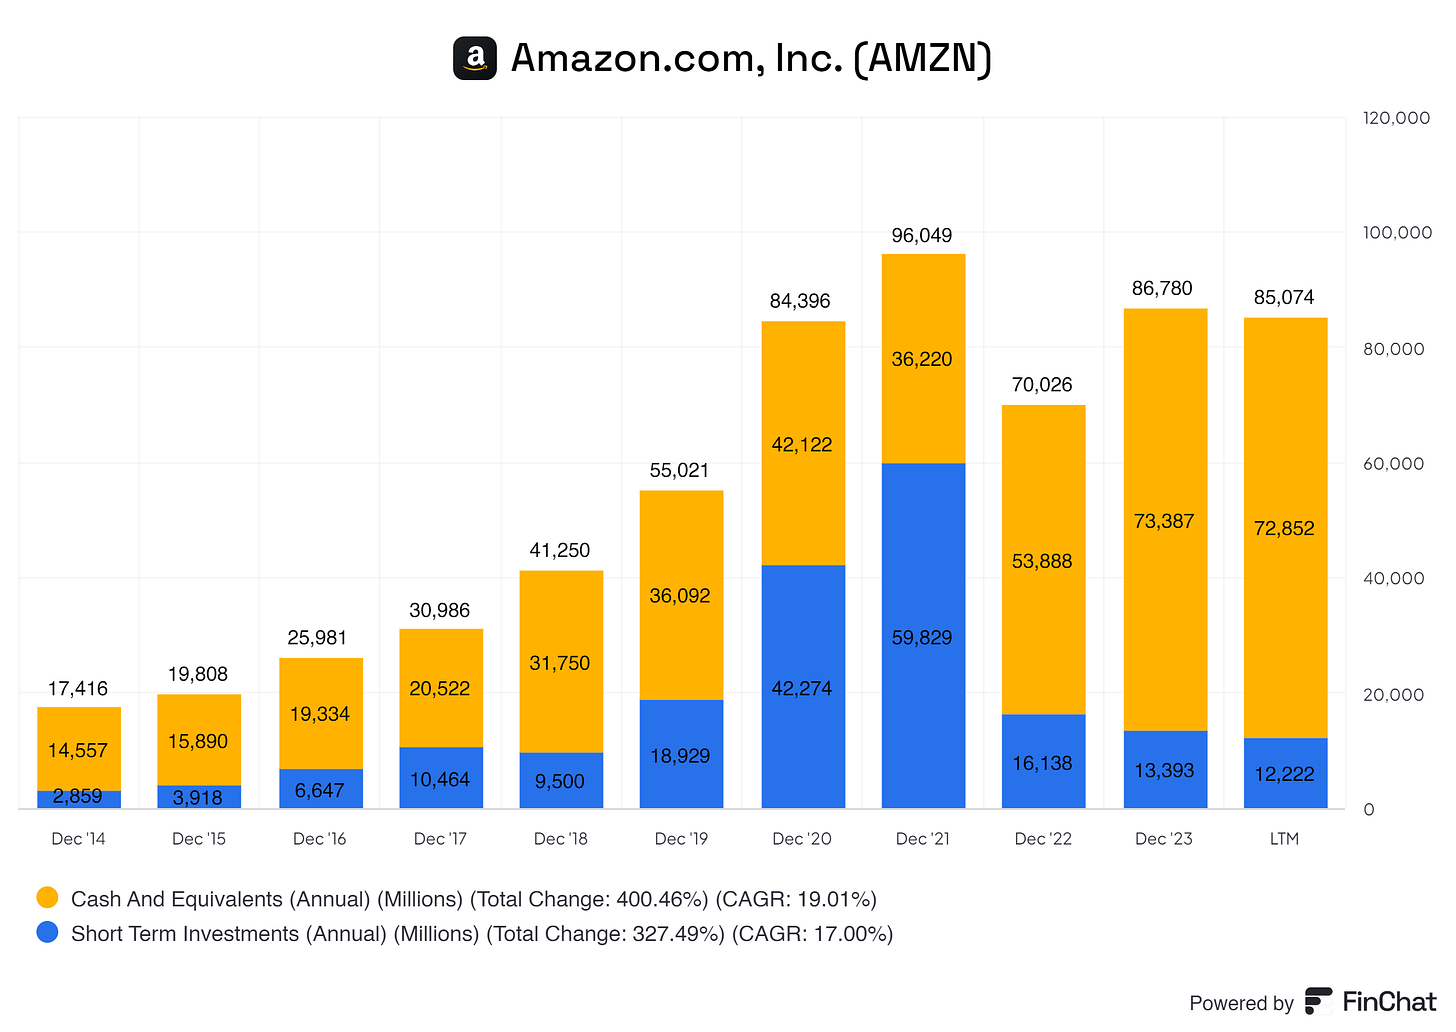
The cash and equivalents rose from $14,557 million in December 2014 to $73,387 million in December 2023, showing that Amazon maintains a robust cash position. This position provides financial flexibility and a cushion for future investments or downturns.
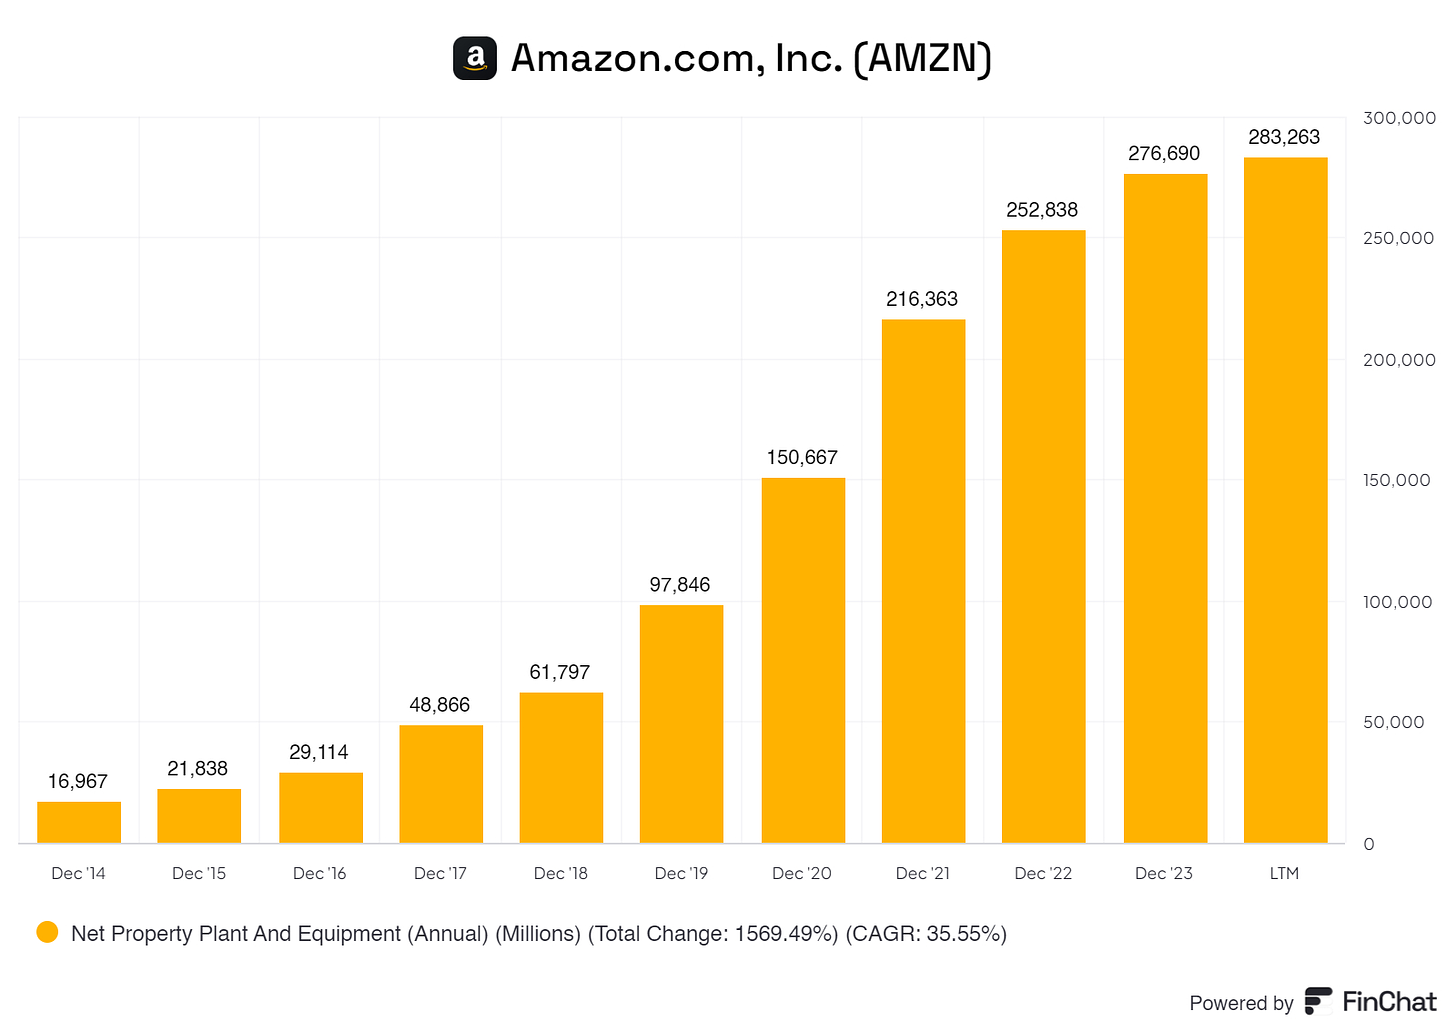
The net property, plant, and equipment have increased to $276,690 million by December 2023 from $16,967 million in December 2014. This indicates that even after accounting for depreciation, Amazon's physical asset base is expanding, which is essential for logistics and cloud services.
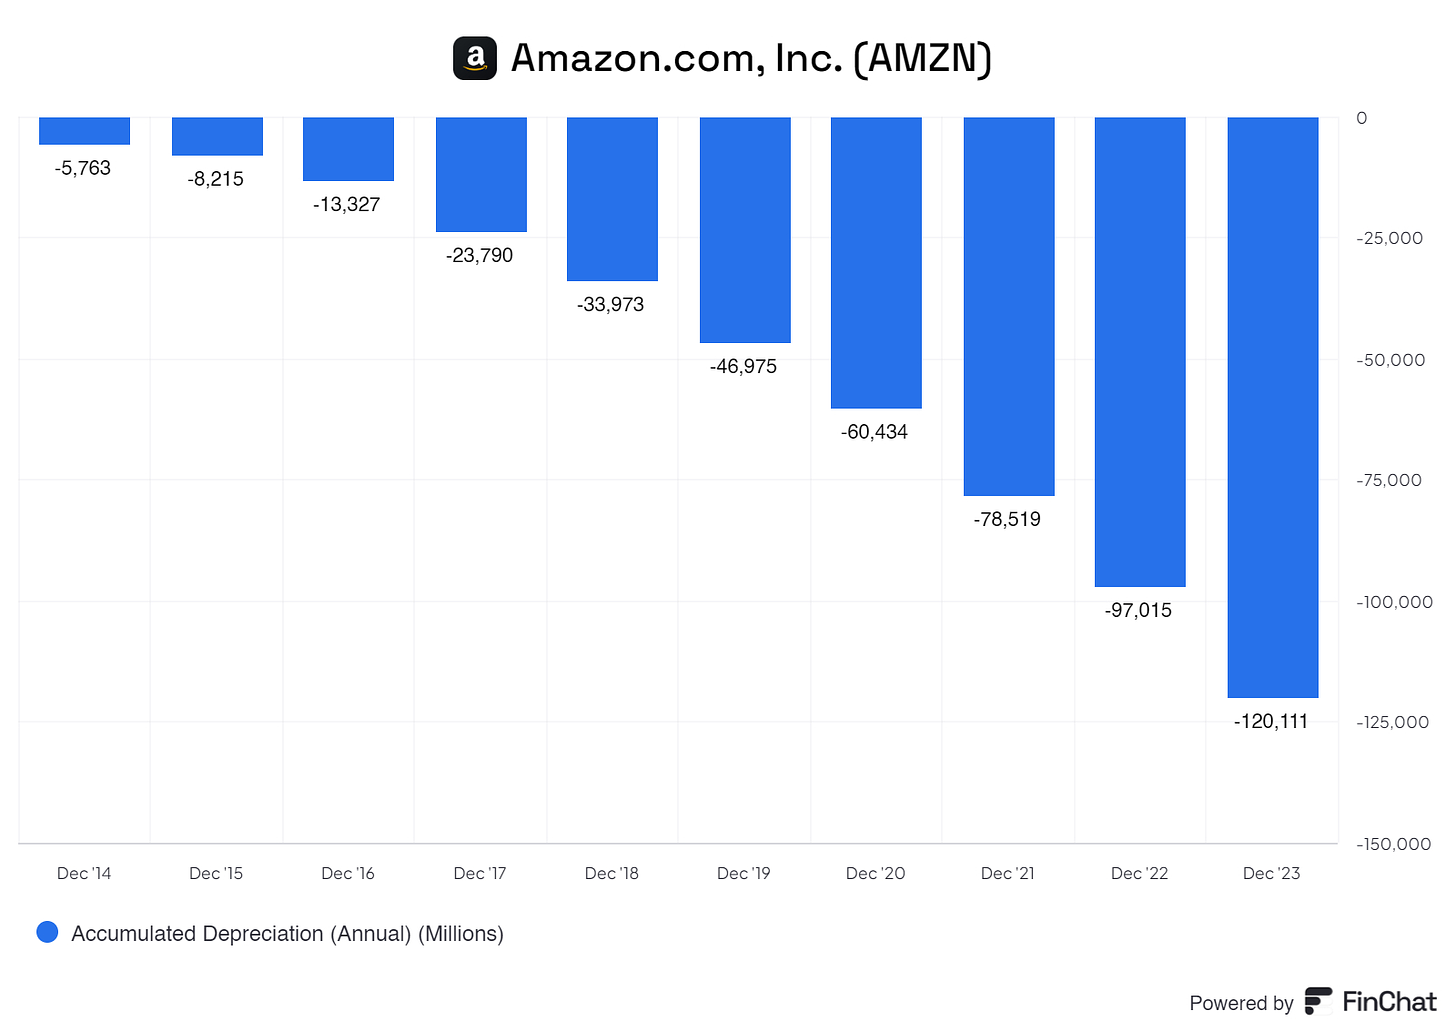
Accumulated depreciation has grown from $5,763 million in December 2014 to $120,780 million in December 2023. While this is expected as PPE ages, it highlights the need to invest in asset maintenance and upgrades to prevent obsolescence continuously.
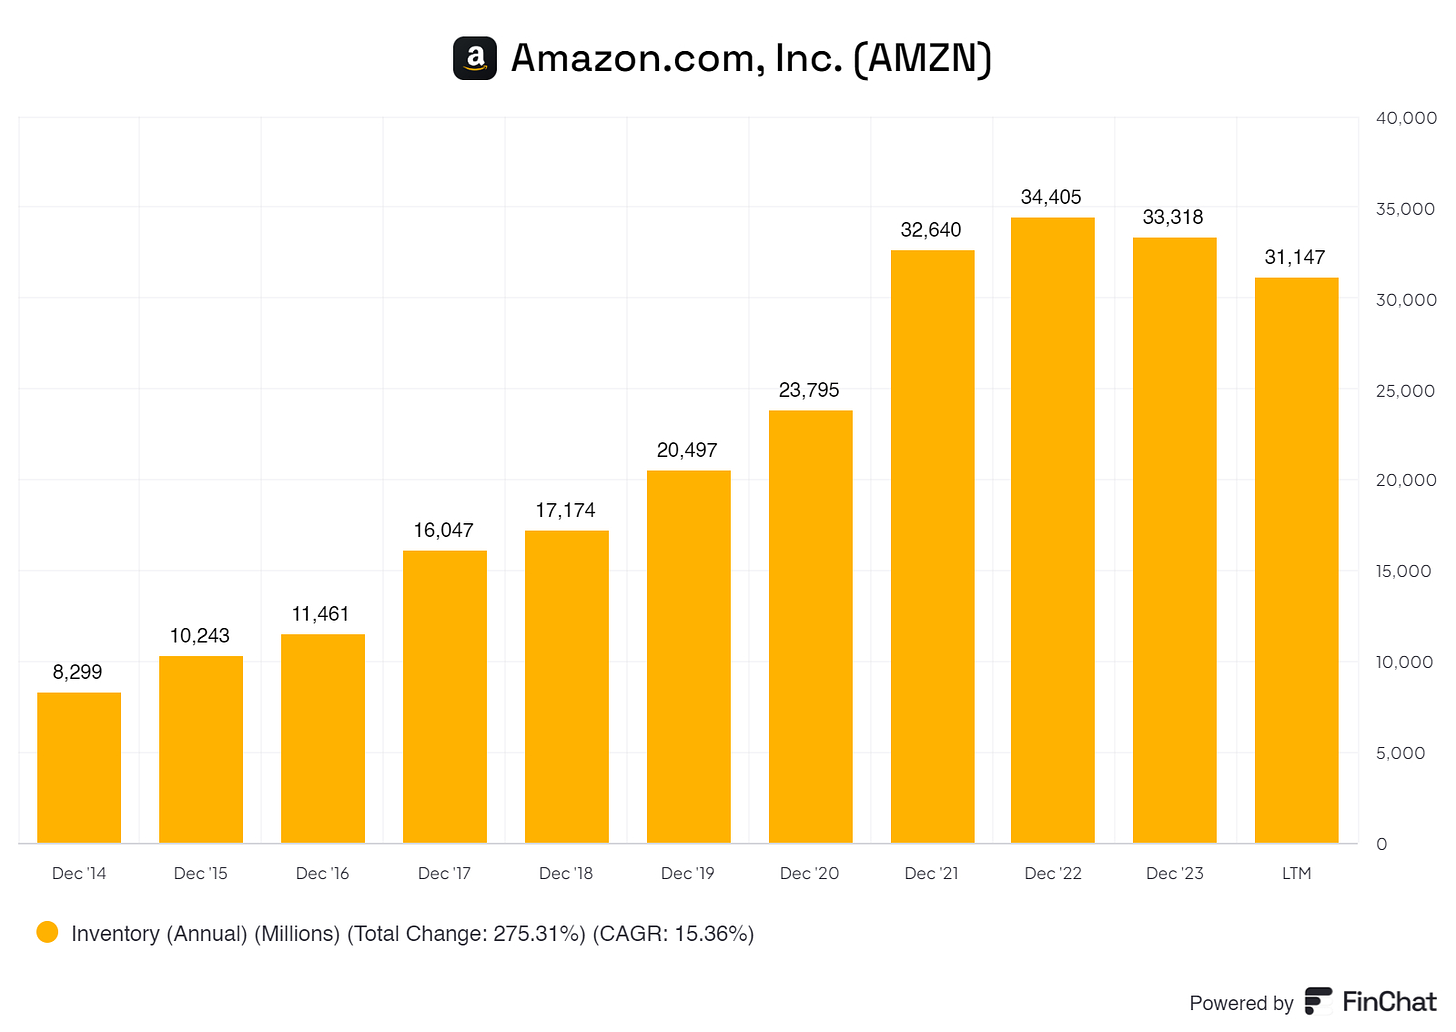
Inventory has fluctuated over the years, reaching $33,318 million in December 2023. Efficient inventory management is critical to avoid overstocking or stockouts, affecting cash flow and sales.
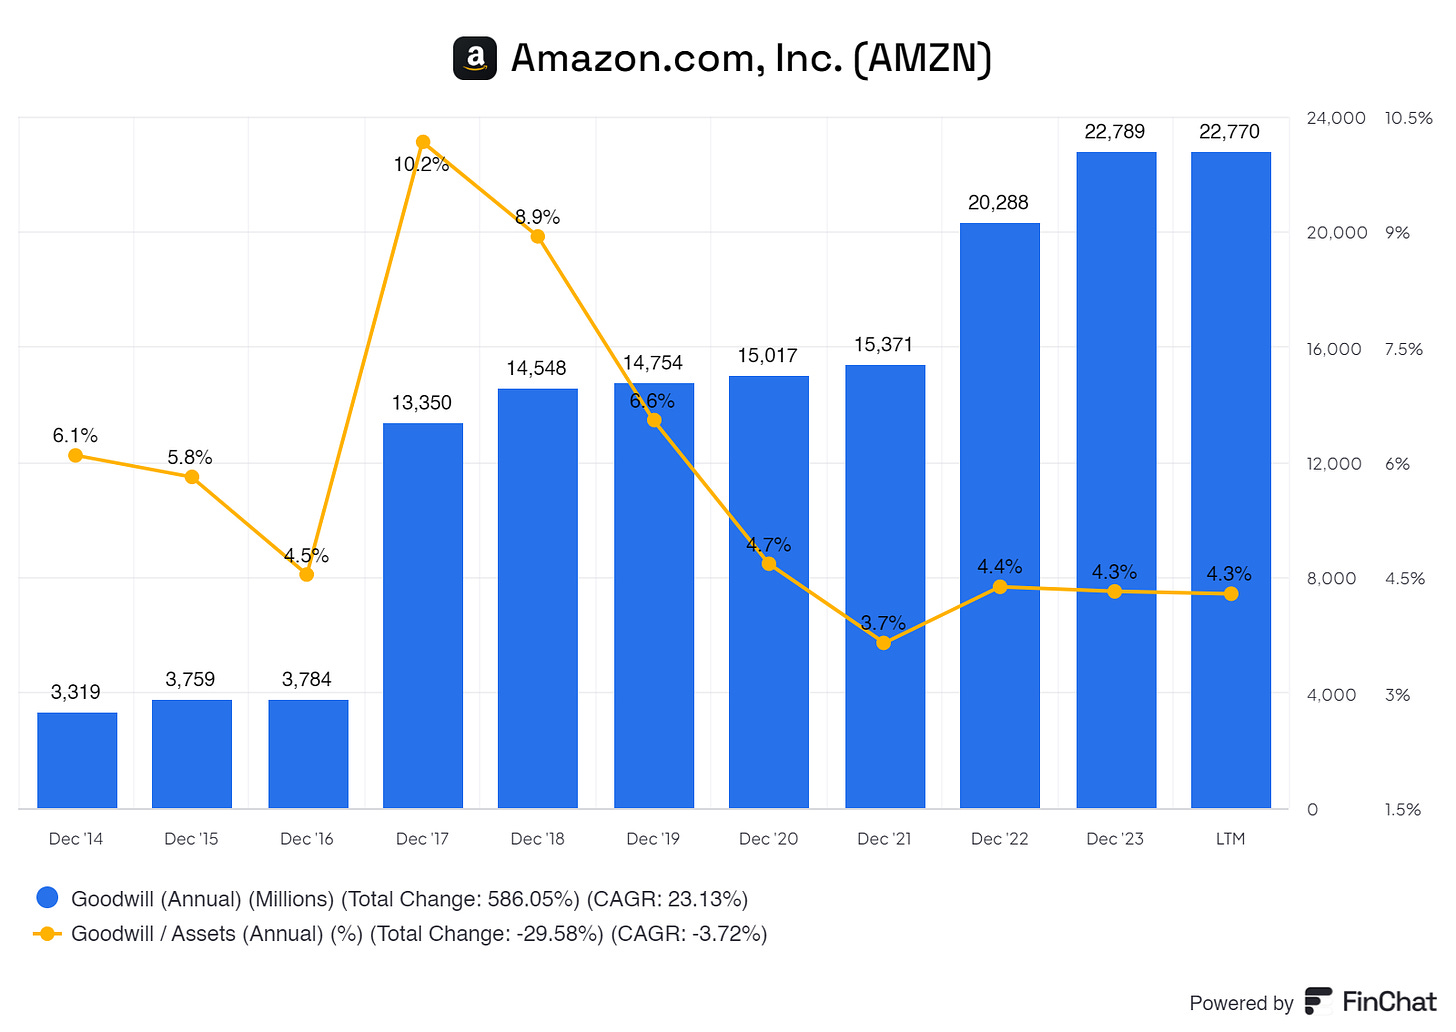
Goodwill is rising rather quickly, and the good thing is that the Goodwill ratio is far below our 20% rule. We must watch for this to ensure that the goodwill-to-assets ratio does not exceed 20%.
Amazon's asset balance sheet indicates robust growth and significant investments in its core infrastructure. The increase in total assets and a strong cash position reflect its capacity to finance operations and strategic initiatives. However, it's crucial to continuously monitor accumulated depreciation, manage receivables efficiently, and optimize inventory to maintain financial health and operational efficiency. Additionally, the high levels of goodwill and intangibles must be handled carefully to ensure they add value to the company.
6.2 Liabilities Assessment
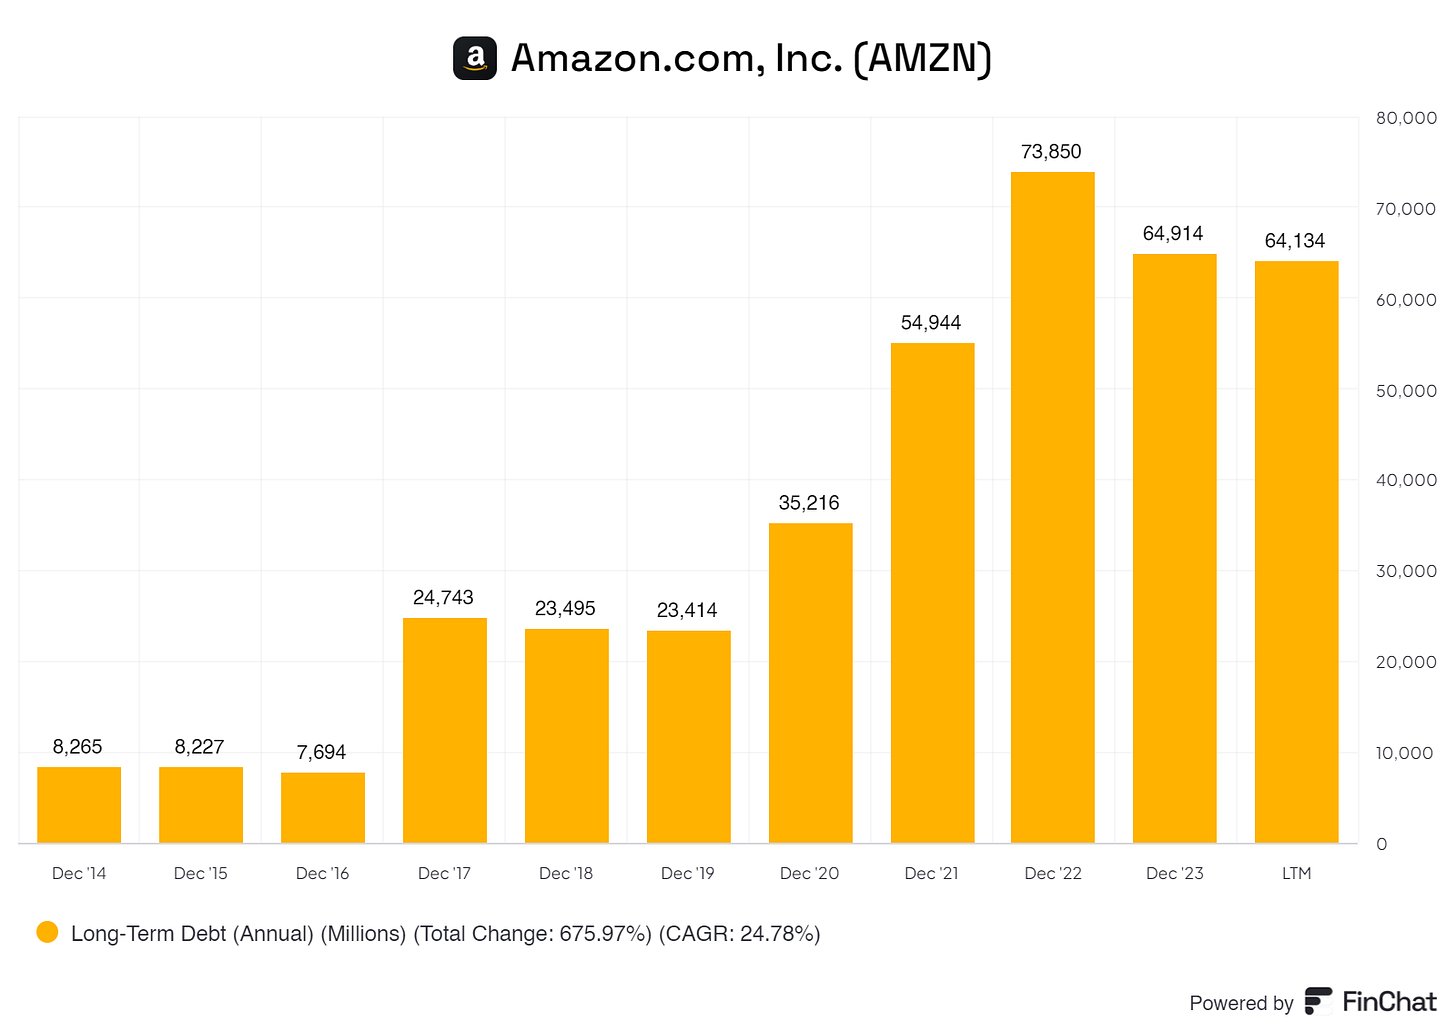
Amazon's long-term debt increased significantly from $8,265 million in December 2014 to $164,917 million in December 2023. However, given its asset growth and cash position, Amazon has managed its long-term debt prudently. Managing long-term debt is crucial for maintaining financial stability and supporting future growth investments.
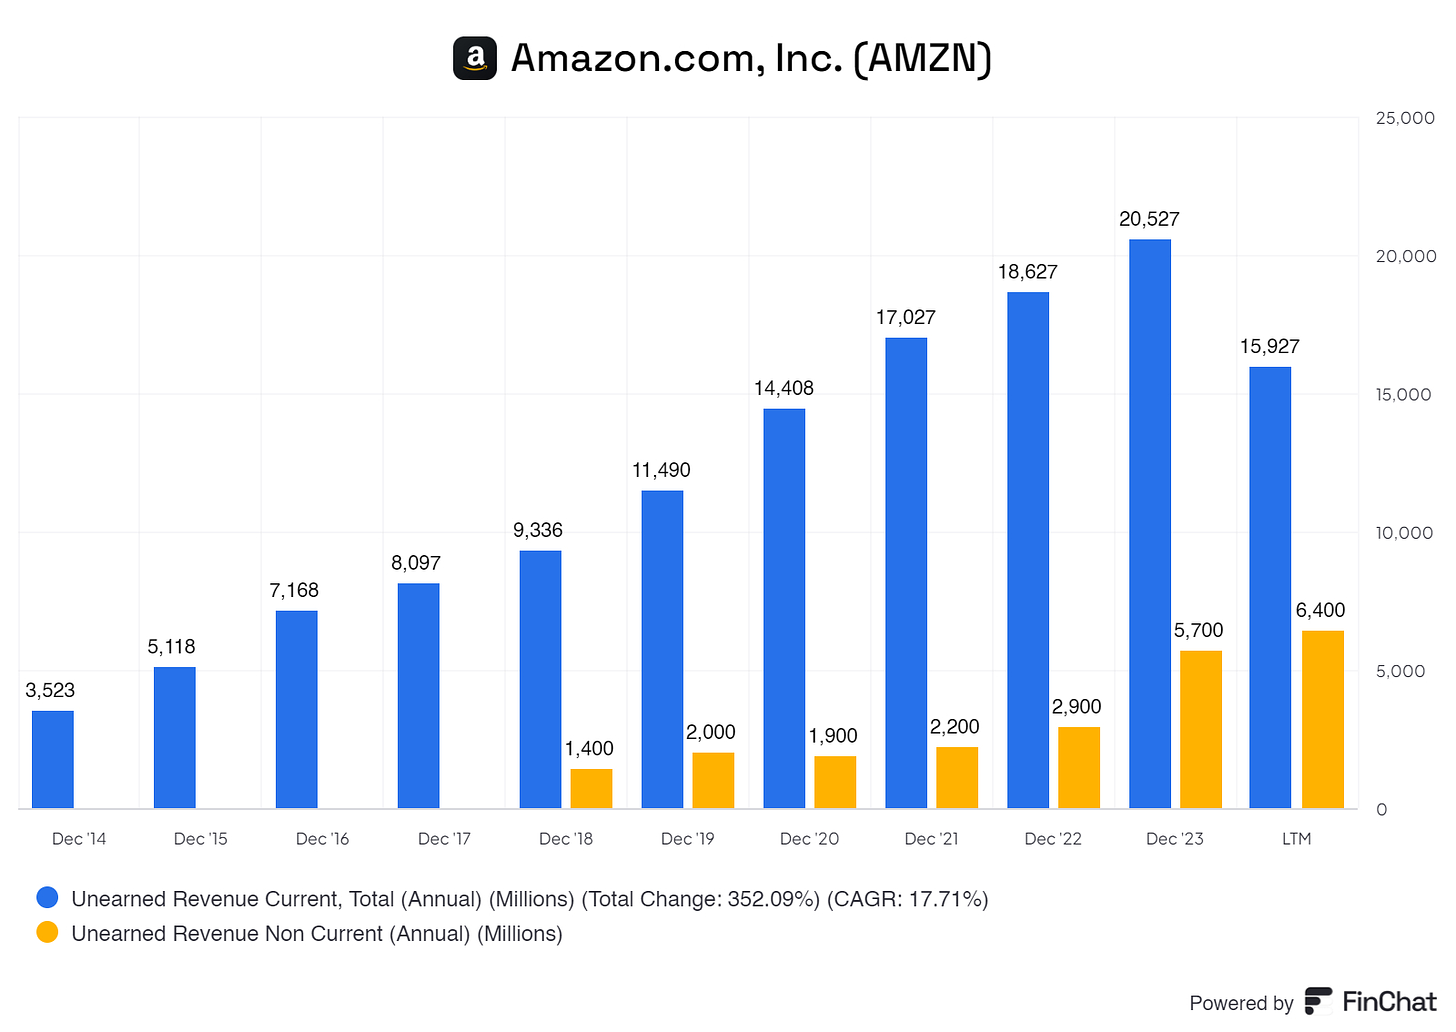
Both current and non-current unearned revenue have shown a steady increase. This is positive as it indicates that Amazon receives cash in advance, reflecting a strong demand for its services, such as Prime subscriptions, AWS contracts, and other prepaid services.
7. Capital Structure
7.1 Expense Analysis
(Click on the photo for a better view)
The table provides an overview of Amazon's key financial metrics from 2015 through the latest trailing twelve months (LTM) ending in 2024. It illustrates trends in cost management, expenditure, and revenue growth, highlighting Amazon's financial performance and strategic execution over this period.
Amazon's Cost of Goods Sold (COGS) has increased significantly from $62,752 million in 2015 to $309,581 million in the latest period. As a percentage of revenue, COGS has shown a downward trend, decreasing from 70.52% in 2015 to 52.41% in the LTM. This decline in COGS percentage indicates that Amazon has effectively managed its production and procurement costs relative to its revenue growth, achieving greater efficiency in its cost structure as it scales its operations.
Selling, General, and administrative (SG&A) expenses have also risen substantially from $16,650 million in 2015 to $147,840 million in the LTM. Despite the increase in absolute terms, SG&A as a percentage of revenue has remained relatively stable, starting at 18.71% in 2015 and reaching 25.03% in the LTM. While SG&A costs have grown, Amazon has kept these expenses in check relative to its revenue, reflecting disciplined cost management and operational efficiency.
Capital Expenditure (CAPEX) has grown significantly, from $4,893 million in 2015 to $53,447 million in the LTM. CAPEX as a percentage of revenue has increased from 5.50% in 2015 to 9.05% in the LTM. This increase suggests that Amazon invests heavily in infrastructure and technology to support its expanding business operations and future growth potential.
Total revenue has grown remarkably, from $88,988 million in 2015 to $590,740 million in the LTM. This substantial increase in revenue showcases Amazon's successful expansion and market penetration, reflecting its strong competitive position and ability to capture a larger market share.
The decreasing COGS-to-revenue ratio suggests that Amazon has effectively managed its cost of goods sold, improving its gross margin as it scales. The stable SG&A-to-revenue ratio indicates that Amazon is achieving operational efficiencies and maintaining disciplined cost control despite its rapid growth. The rise in CAPEX relative to revenue implies that Amazon strategically invests in capital-intensive projects, such as fulfillment centers and technology infrastructure, to enhance its long-term capabilities and competitive edge.
Amazon has demonstrated impressive revenue growth, underpinned by effective cost management and strategic investments. The company has successfully reduced its COGS as a percentage of revenue, maintained stable SG&A costs, and strategically increased CAPEX to support its growth ambitions. These trends reflect Amazon's robust financial health, operational efficiency, and strategic execution, positioning the company for continued success in the future. Investors can view these developments as positive indicators of Amazon's robust business model and long-term growth potential.
In addition, Amazon spends large amounts of capital on R&D, ensuring its positions remain theirs.
I love it when businesses continue to spend on Research and Development, especially when the business is operating in the cloud segment like Amazon. Investments like these ensure Amazon's continued leadership.
7.2 Capital Efficiency Review
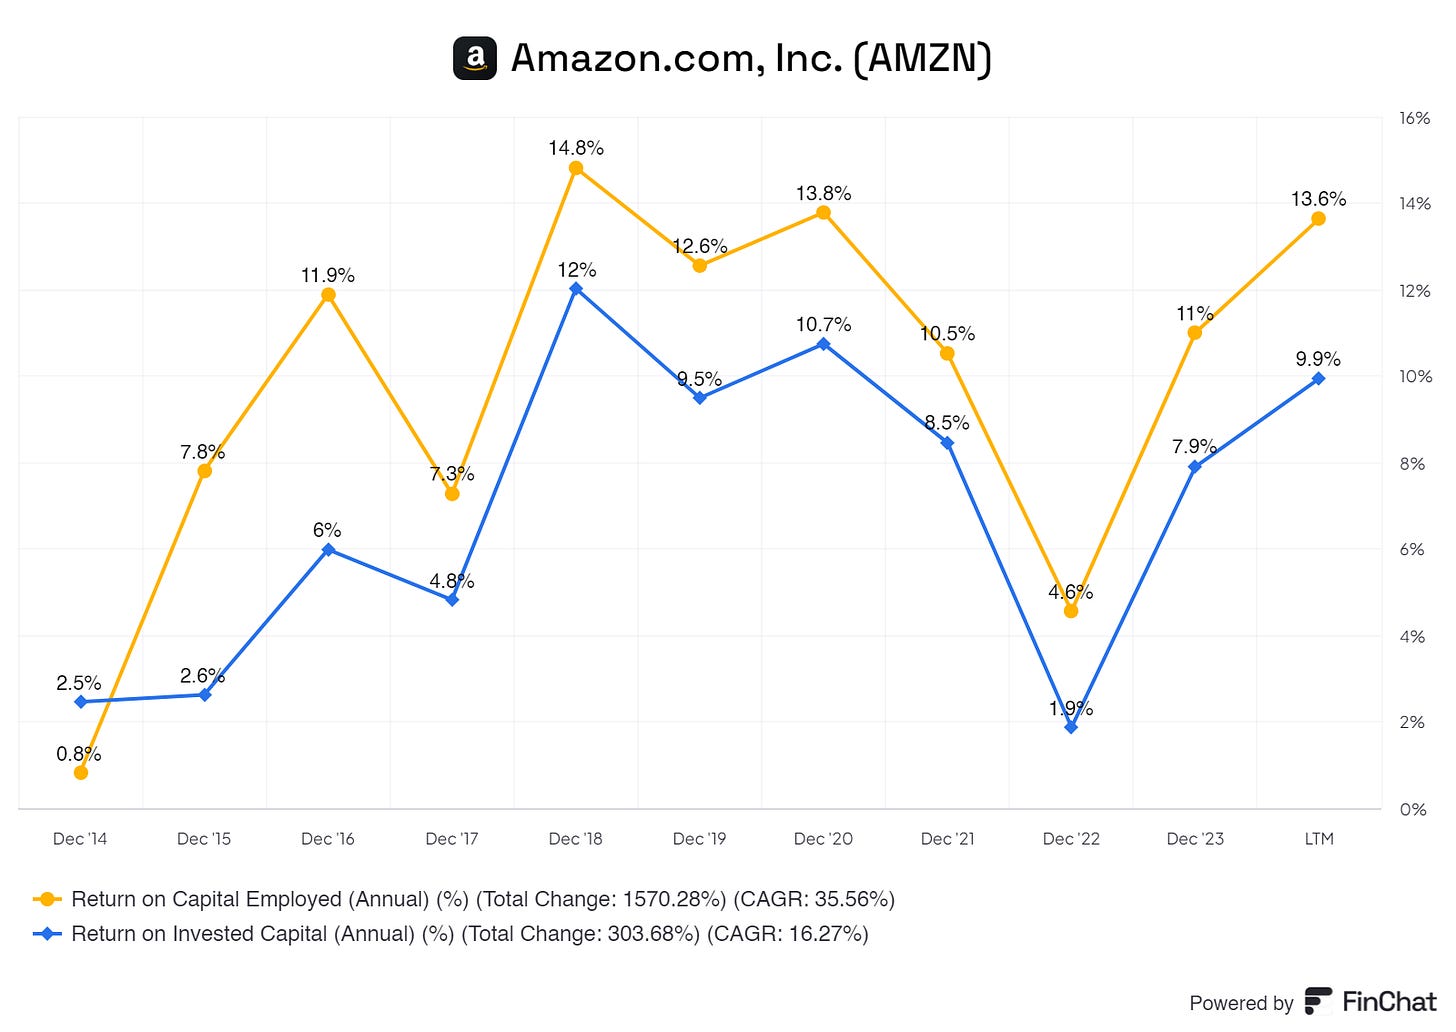
ROCE and ROIC provide valuable insights but will not fully capture Amazon’s strategic reinvestment approaches and asset-heavy model despite solid returns. Seeing Amazon reach 15% to 20% would be ideal, but again, due to the high capital expenditures, this might not happen. Therefore, ROIC and ROCE give skewed images. We do know that Amazon has always and will continue investing large amounts of capital for future growth, suppressing ROIC and ROCE in the short term.
8. Profitability Assessment
8.1 Profitability, Sustainability, and Margins
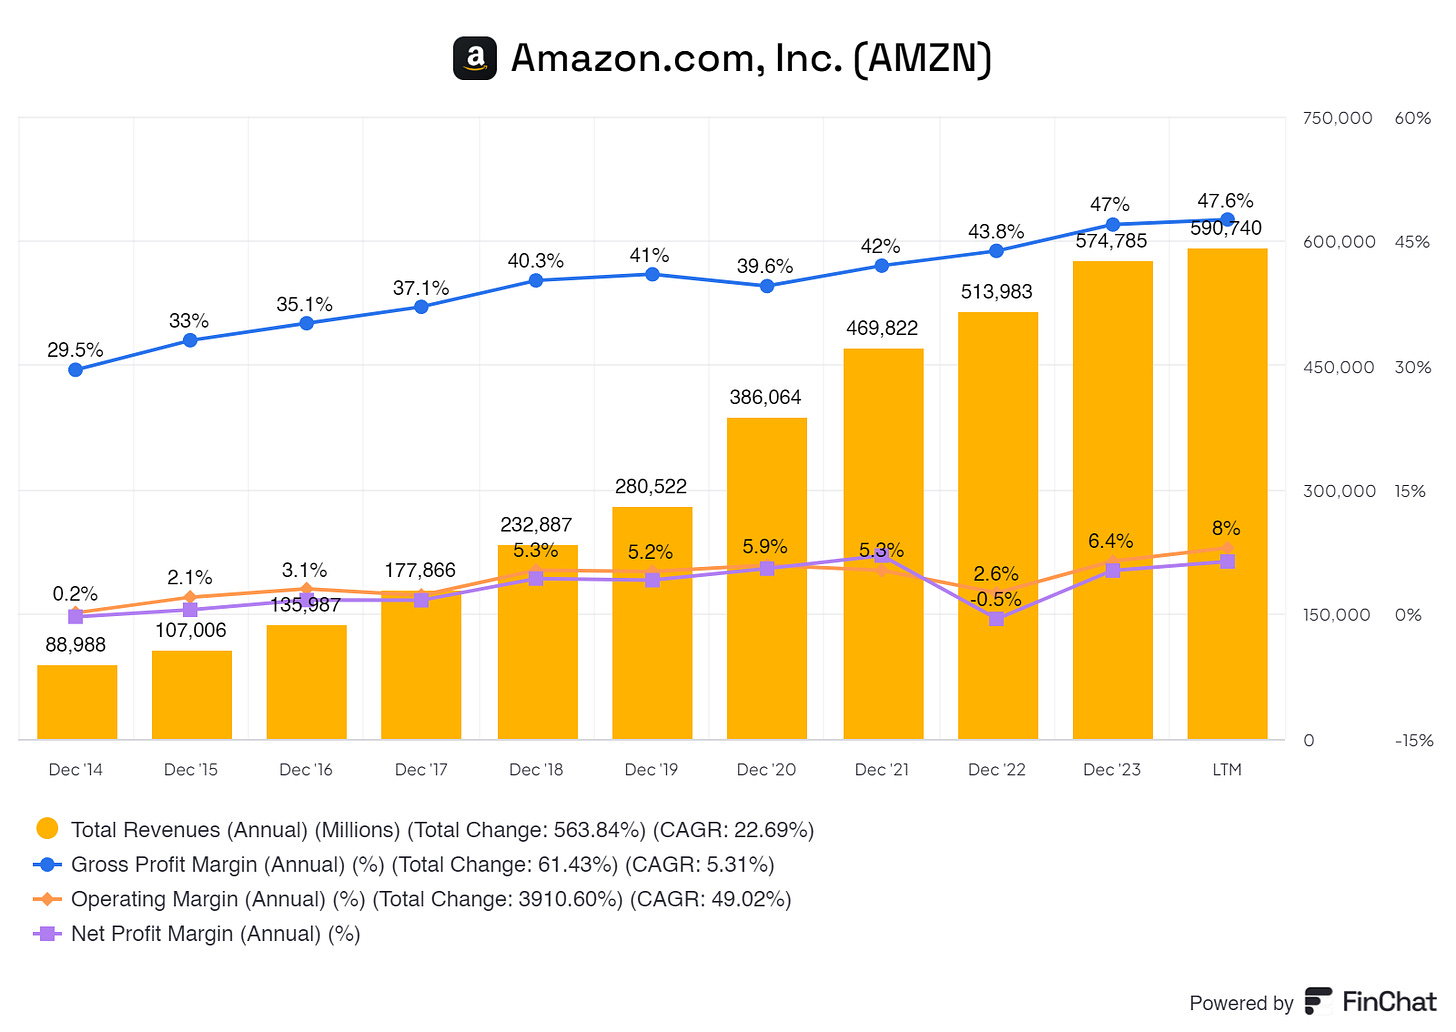
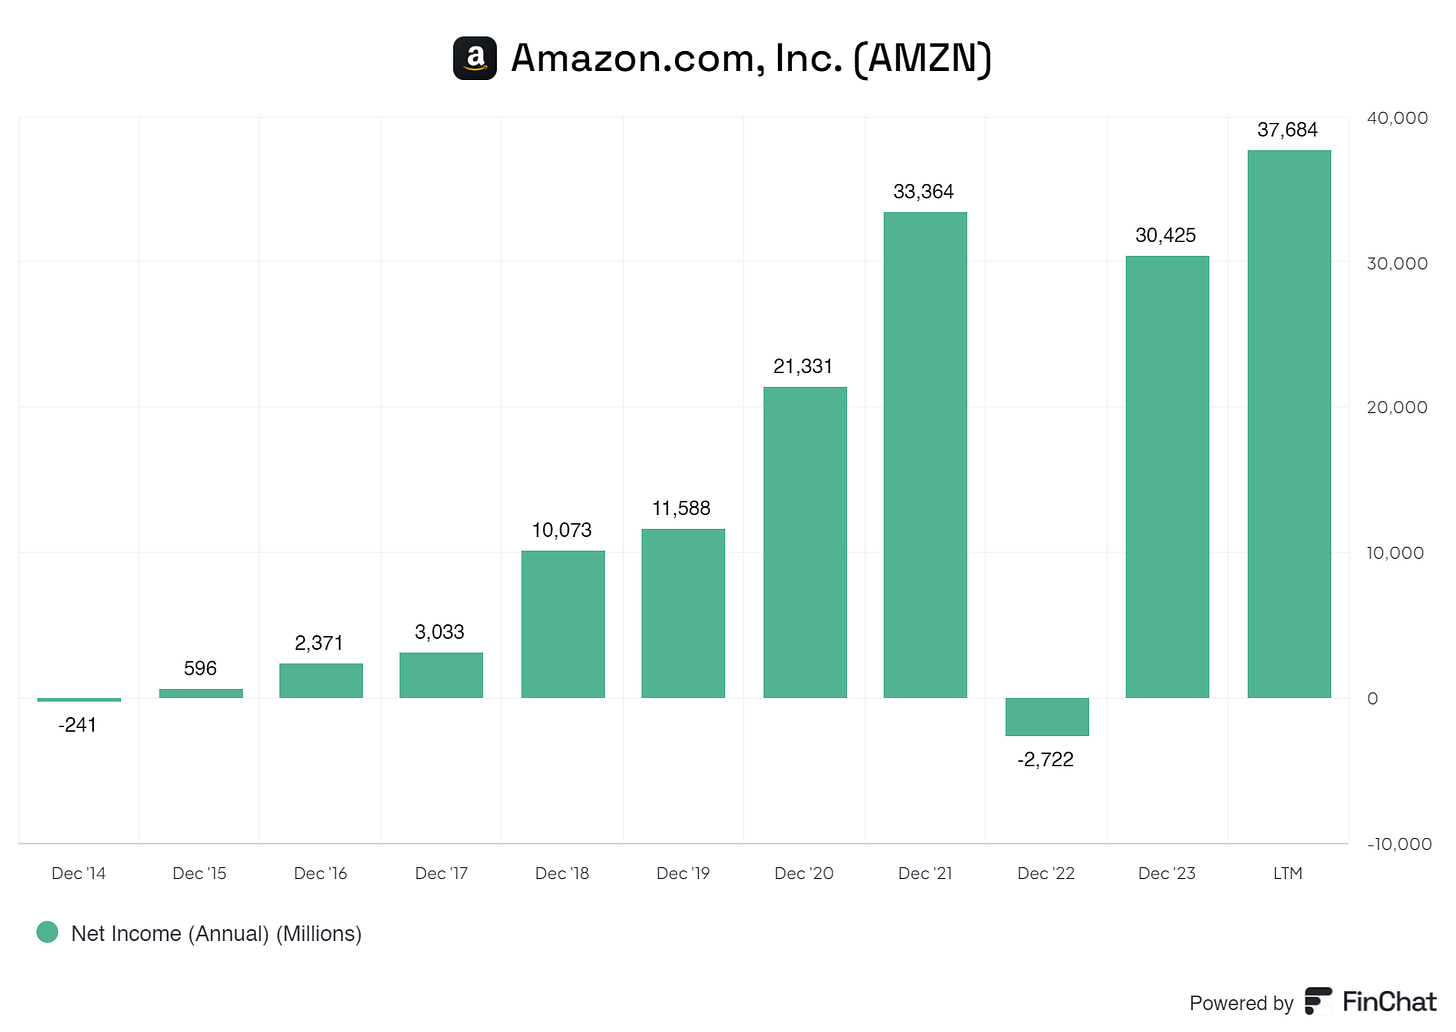
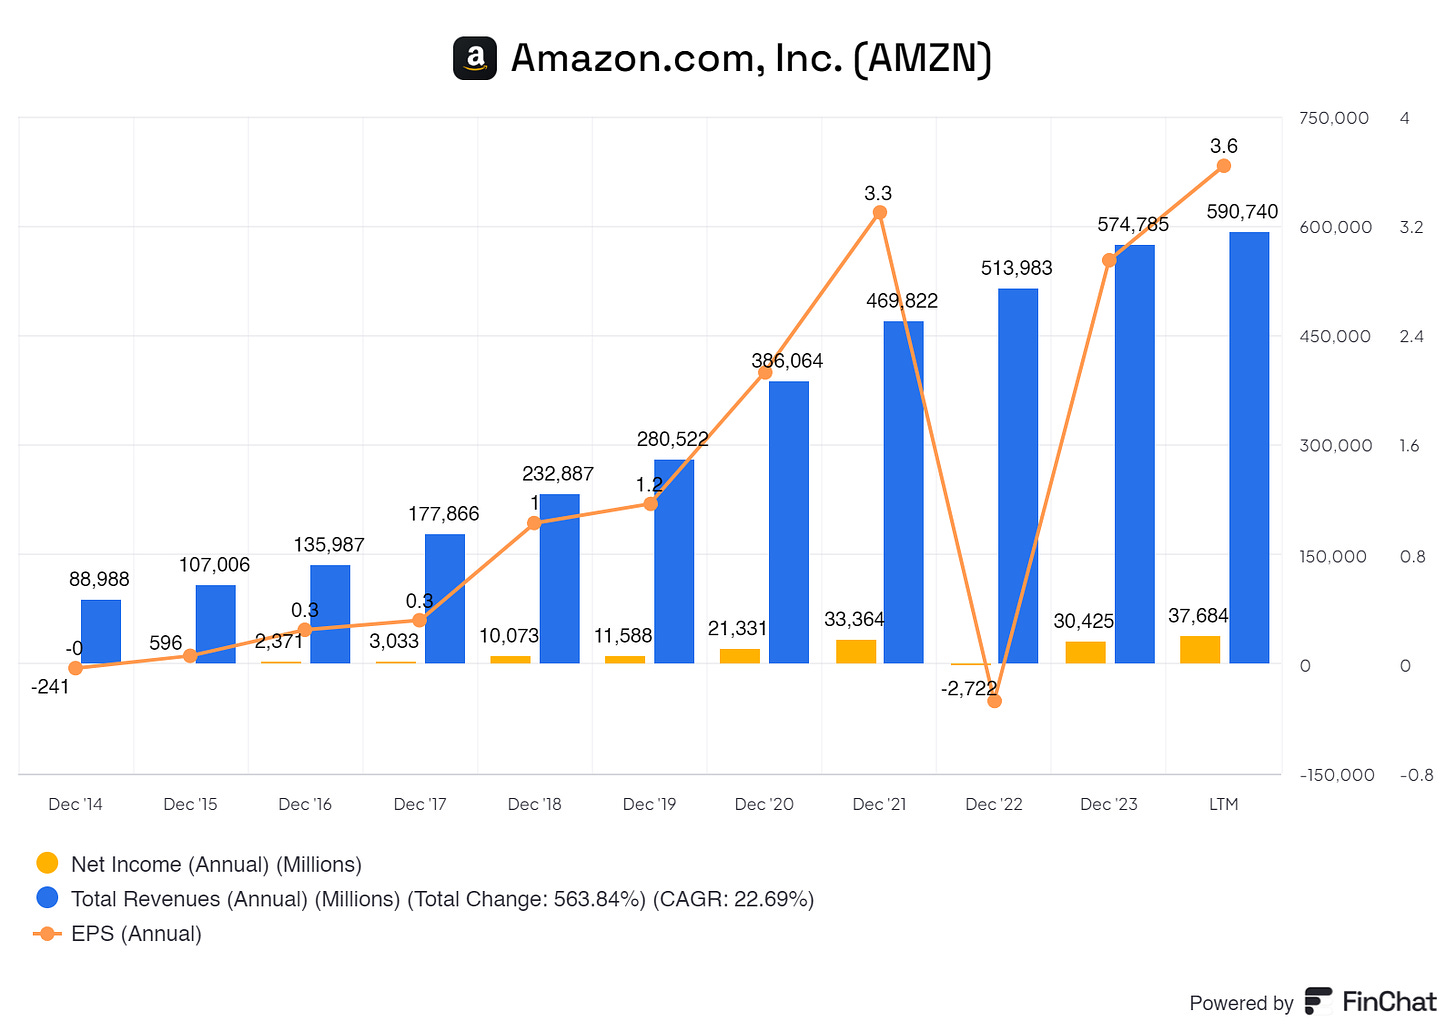
Amazon has excellent margins all over the board. Gross profit margins are increasing YoY, as are the operating and net profit margins. Total Revenue is growing at excellent rates. Of course, due to the business maturing, Total Revenues are slowing down, as expected when a business matures. Nevertheless, there is improvement and growth all over the board.
Net Revenue wise, Amazon is doing exceptionally well. I think we can all figure out why Amazon didn’t turn a profit in 2022. :-)
8.2 Cash Flow Analysis
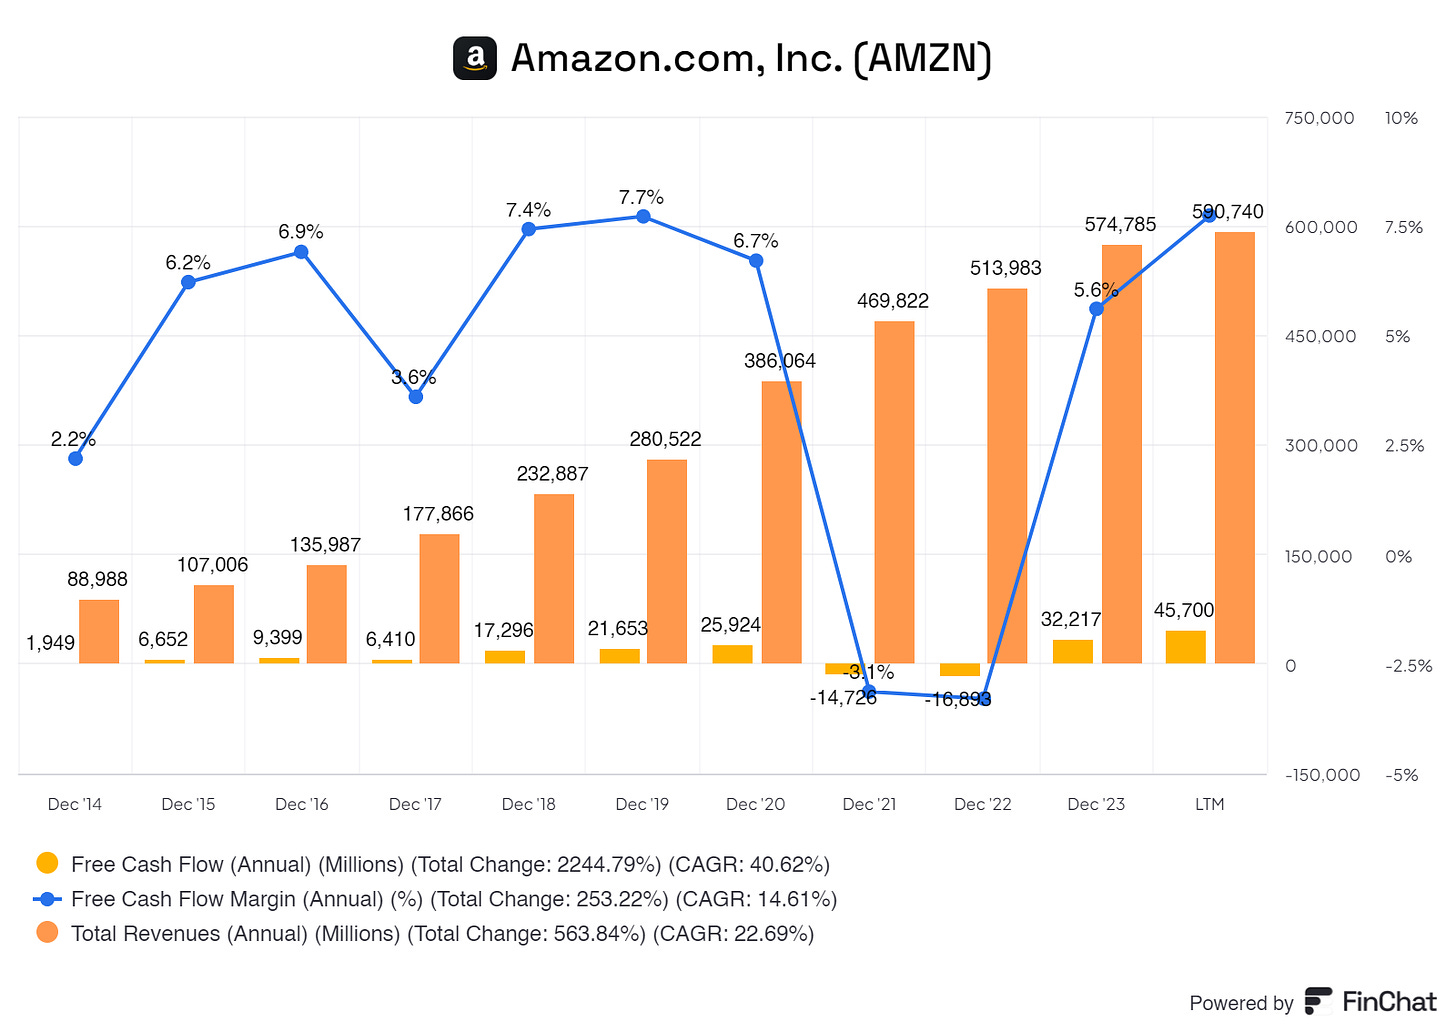
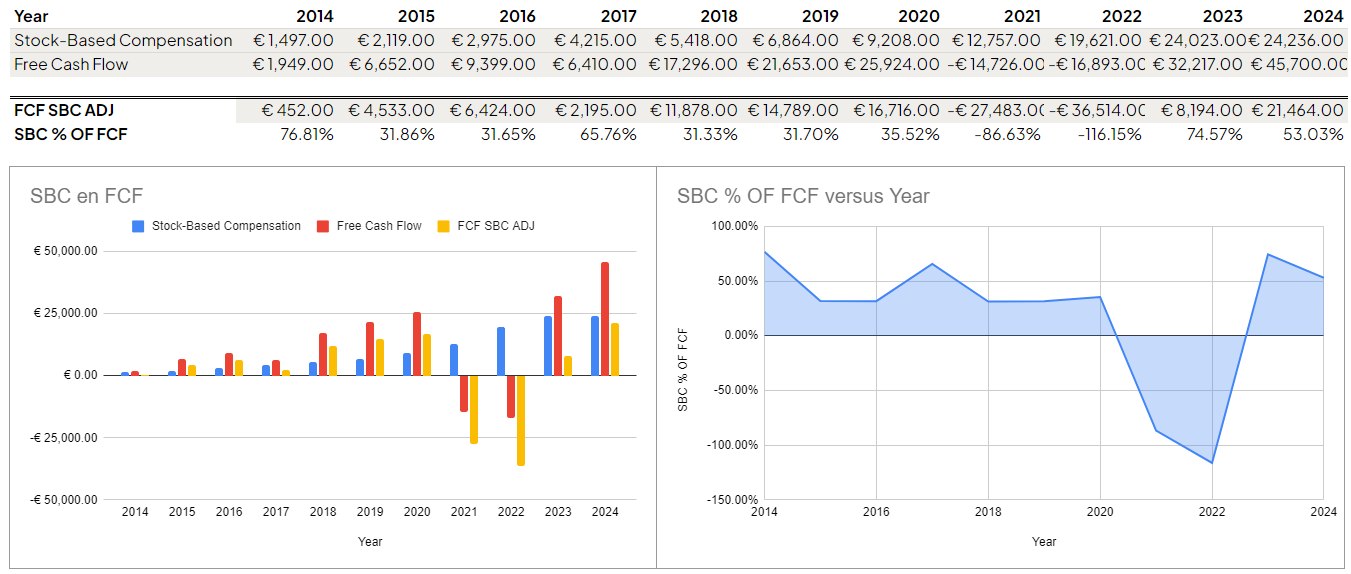
Amazon is a capital expenditure cost beast; therefore, it is logical that there will be less free cash flow at the end of every quarter or year. However, even this gives a skewed image due to stock-based compensation, as Amazon has a big compensation plan in play, impacting free cash flow.
(Due note: some years, FCF was negative, but SBC was positive; this gives a skewed image on my end, sorry. I am not a superhero with Google Spreadsheet, haha)
(Click on the photo for a better view)
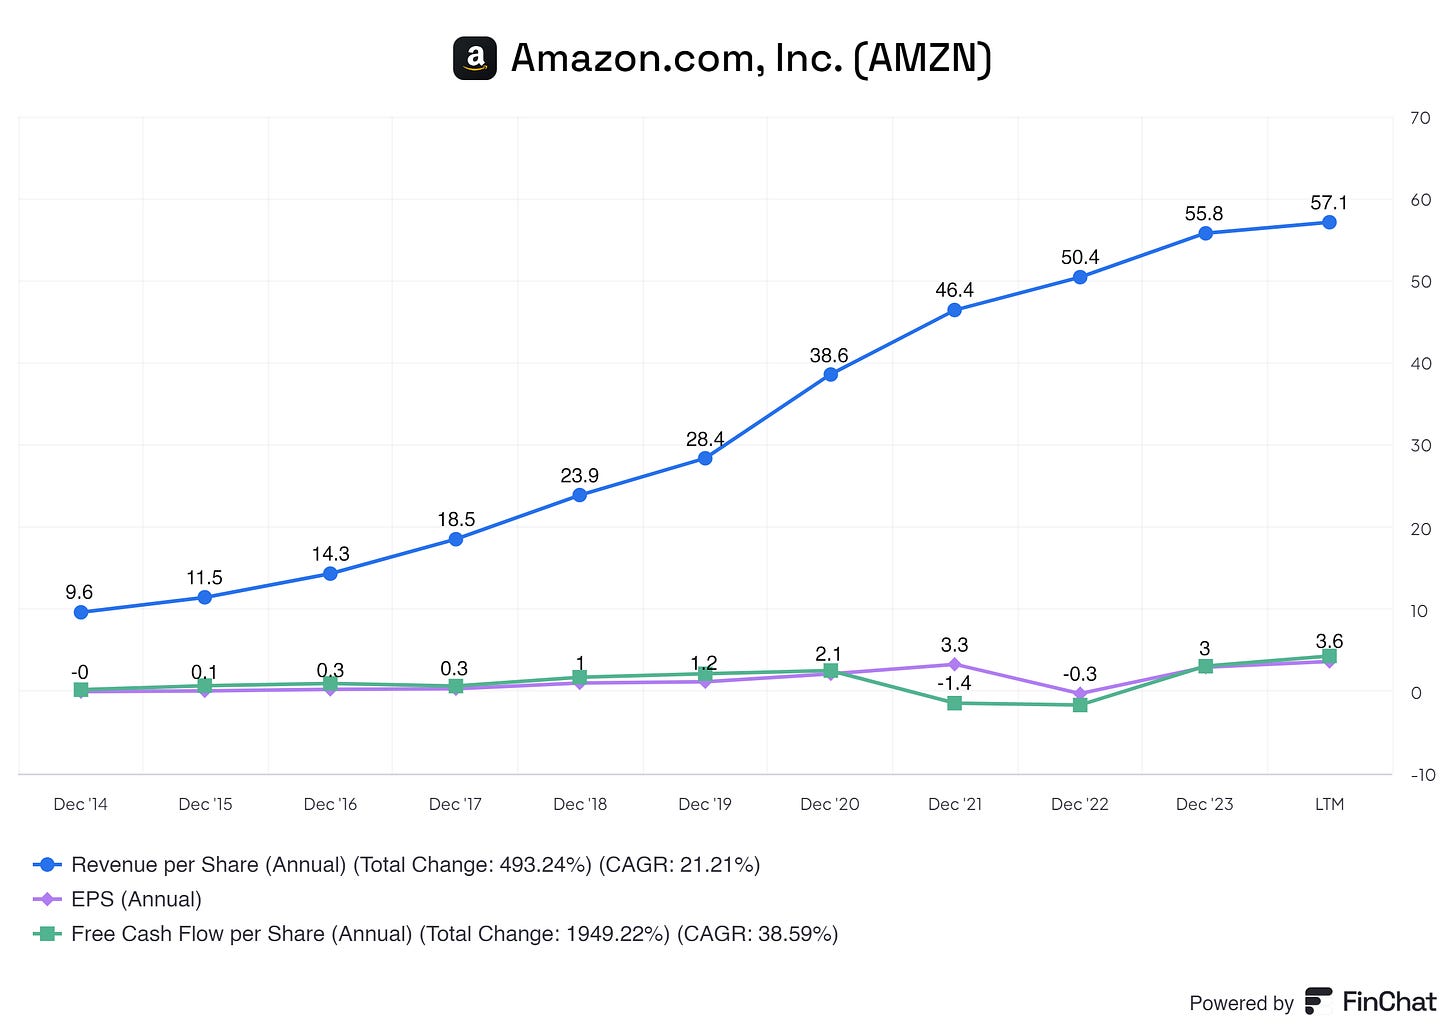
If we adjust Free Cash Flow for Stock-based Compensation, we paint a completely different picture of Amazon’s Free Cash Flow.
9. Growth Analysis
9.1 Historical Growth Trends
Amazon has shown excellent growth in the previous years, which is nothing too crazy. Total Revenue grew over the past 10 years with an excellent CAGR of 22.73%. Historically, Amazon has been growing at steady rates. In this overview, I do not consider any issues or concerns. Even during the pandemic, Salesforce pushed its products to its customers, signaling the need for the products and services from Amazon.
9.2 Future Growth Projections
Amazon’s future is looking extremely bright. I’ve looked into plenty of research papers and articles, and we’re all coming to the same conclusion: massive growth.
I estimated roughly 28% to 33% growth over the next five years for Amazon, most analysts agree with me. With the increase in cloud and e-commerce, Amazon will significantly benefit from more revenues. Of course, do your research. However, I think Amazon will grow significantly, especially in the international segment; there’s loads of room for growth for Amazon. I wouldn’t be surprised if Amazon grows even more instead of 28% to 33%.
10. Value Proposition
10.1 Dividends Analysis
Amazon, fortunately, does not pay a dividend and soon is not planning on paying a dividend. I agree there. Keep pumping the business and invest in PPE to further boost Amazon International.
10.2 Share Repurchase Programs
The board has long authorized Amazon to repurchase its shares, but executives have sporadically done so. Amazon in 2022 announced a program of up to $10 billion in buybacks, but the Seattle-based company hasn't executed any since the second quarter of that year.
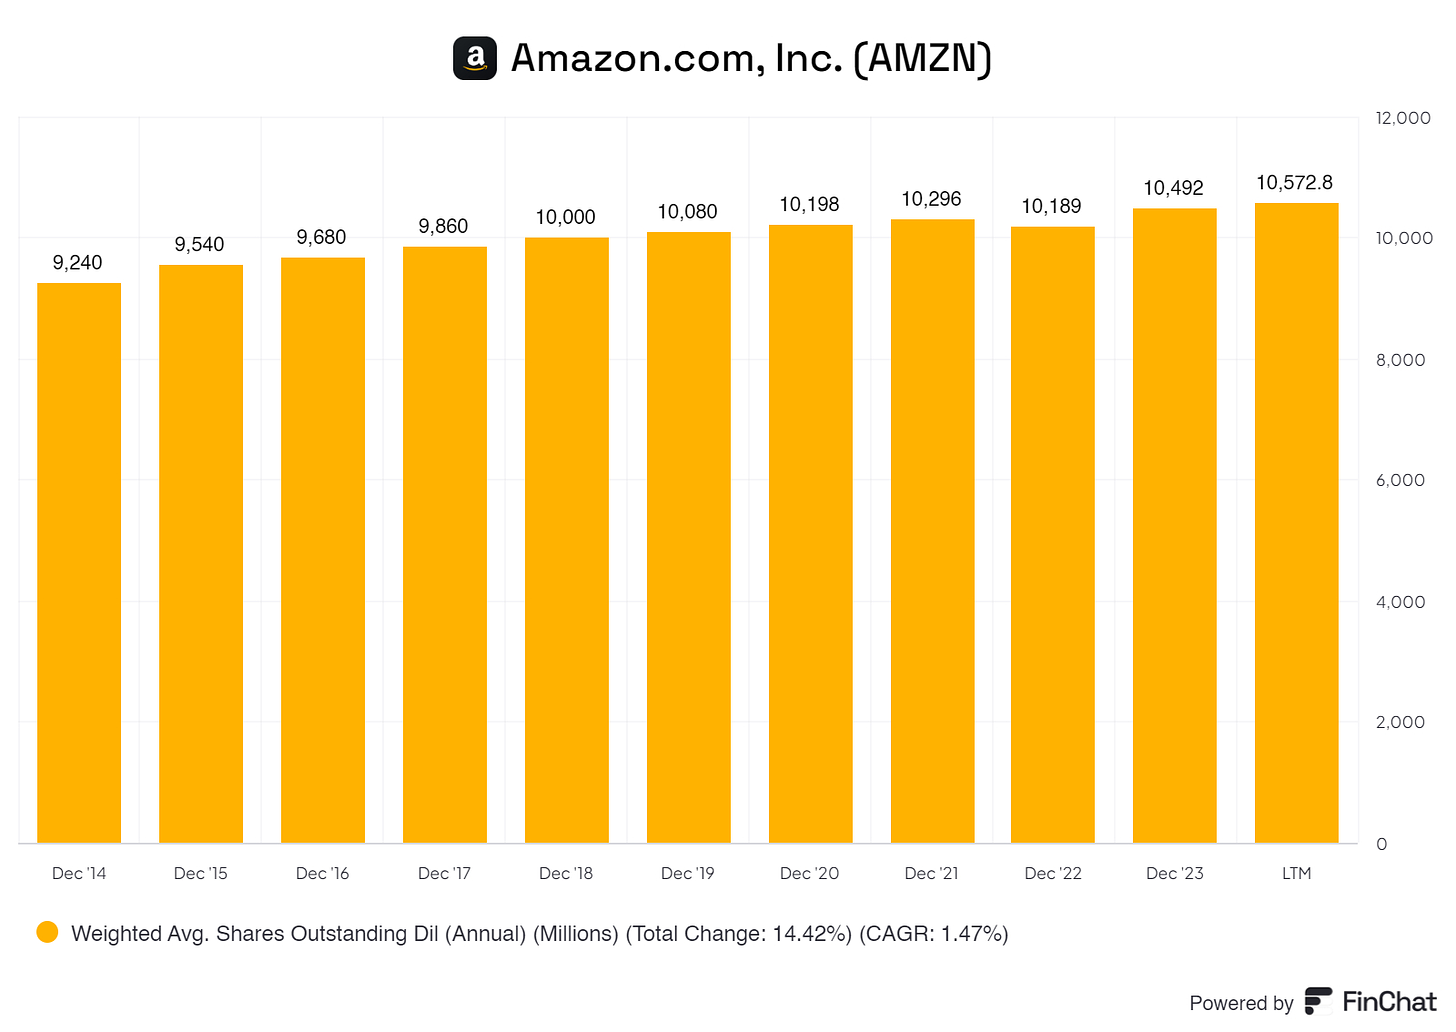
As of today, Amazon has diluted its shareholders.
10.3 Debt Reduction Strategy
Amazon does pay off debt, but it’s not their primary focus. Amazon leverages debt well and should continue doing so to grow.
11. Future Outlook
Amazon.com, Inc. is well-positioned for continued growth and success, driven by its diversified revenue streams, global expansion, strong leadership, and competitive advantages. Looking ahead, several key factors and strategies will play a crucial role in shaping Amazon's future:
Amazon's diversified business model is a robust foundation for sustained growth and resilience. Amazon can navigate economic fluctuations effectively with significant revenue contributions from its online stores, AWS, subscription services, advertising, third-party seller services, and physical stores. The company's ability to leverage multiple revenue streams reduces its reliance on any single segment, providing a safety net against downturns. This strategic diversification is expected to drive steady revenue growth and ensure financial stability in the coming years.
AWS remains a pivotal growth engine for Amazon, and its prospects are exceptionally bright. The global cloud computing market is projected to expand at a compound annual growth rate (CAGR) of 21.2% from 2024 to 2030, driven by increasing demand for digital transformation and scalable computing solutions. AWS is poised to capitalize on this growth, leveraging its extensive portfolio of services, including EC2, S3, and advanced analytics. As more enterprises adopt cloud solutions, AWS's market share and profitability are expected to increase, further enhancing Amazon's financial performance.
Amazon's strategic focus on international expansion is crucial for its long-term growth trajectory. While North America currently accounts for a significant portion of its revenue, it is making significant inroads in international markets. The growing revenue share from regions outside North America, particularly in Europe and Asia, underscores Amazon's success in expanding its global footprint. This geographic diversification reduces Amazon's exposure to regional economic risks and regulatory changes, positioning the company to benefit from emerging market opportunities and a broader customer base.
The e-commerce market continues to exhibit strong growth potential, with a projected CAGR of 19% up to 2030. As consumer preferences shift towards online shopping due to convenience and time constraints, Amazon is well-positioned to capture an increasing market share. The company's focus on enhancing the customer experience through innovative technologies, personalized recommendations, and efficient logistics will drive higher sales and customer loyalty. Additionally, Amazon's investments in physical retail stores, such as Amazon Fresh and Whole Foods, will complement its online presence and provide customers with a seamless omnichannel shopping experience.
Amazon's competitive advantages, including brand power, scale and cost efficiencies, high switching costs, and network effects, will continue to bolster its market leadership. The company's commitment to innovation, research, and development will further strengthen its position. Amazon's extensive portfolio of patents, particularly in logistics, cloud computing, and artificial intelligence, will protect its intellectual property and provide a competitive edge in developing new technologies and services.
Under the leadership of CEO Andrew Jassy, Amazon is poised to maintain its strategic direction and continue its legacy of innovation and customer focus. Jassy's deep experience with AWS and strong alignment with Amazon's values and shareholder interests will ensure that the company remains agile and responsive to market changes. Additionally, Amazon's ability to attract and retain top talent will drive innovation and sustain its competitive advantage.
Amazon's vital financial health, characterized by robust cash reserves and prudent long-term debt management, provides a solid foundation for strategic investments and future growth. The company's focus on optimizing its capital structure and maintaining financial flexibility will enable it to seize growth opportunities and navigate economic uncertainties effectively. Continued infrastructure, technology, and new venture investments will support Amazon's long-term growth ambitions.
In conclusion, Amazon's future outlook is highly promising, driven by its diversified business model, strategic global expansion, technological innovation, and strong leadership. The company's ability to adapt to market trends, capitalize on emerging opportunities, and maintain its competitive advantages will be vital in sustaining growth and delivering value to shareholders. As Amazon continues to evolve and expand its operations, it is well-positioned to remain a dominant force in e-commerce, cloud computing, and beyond, ensuring long-term success and profitability.
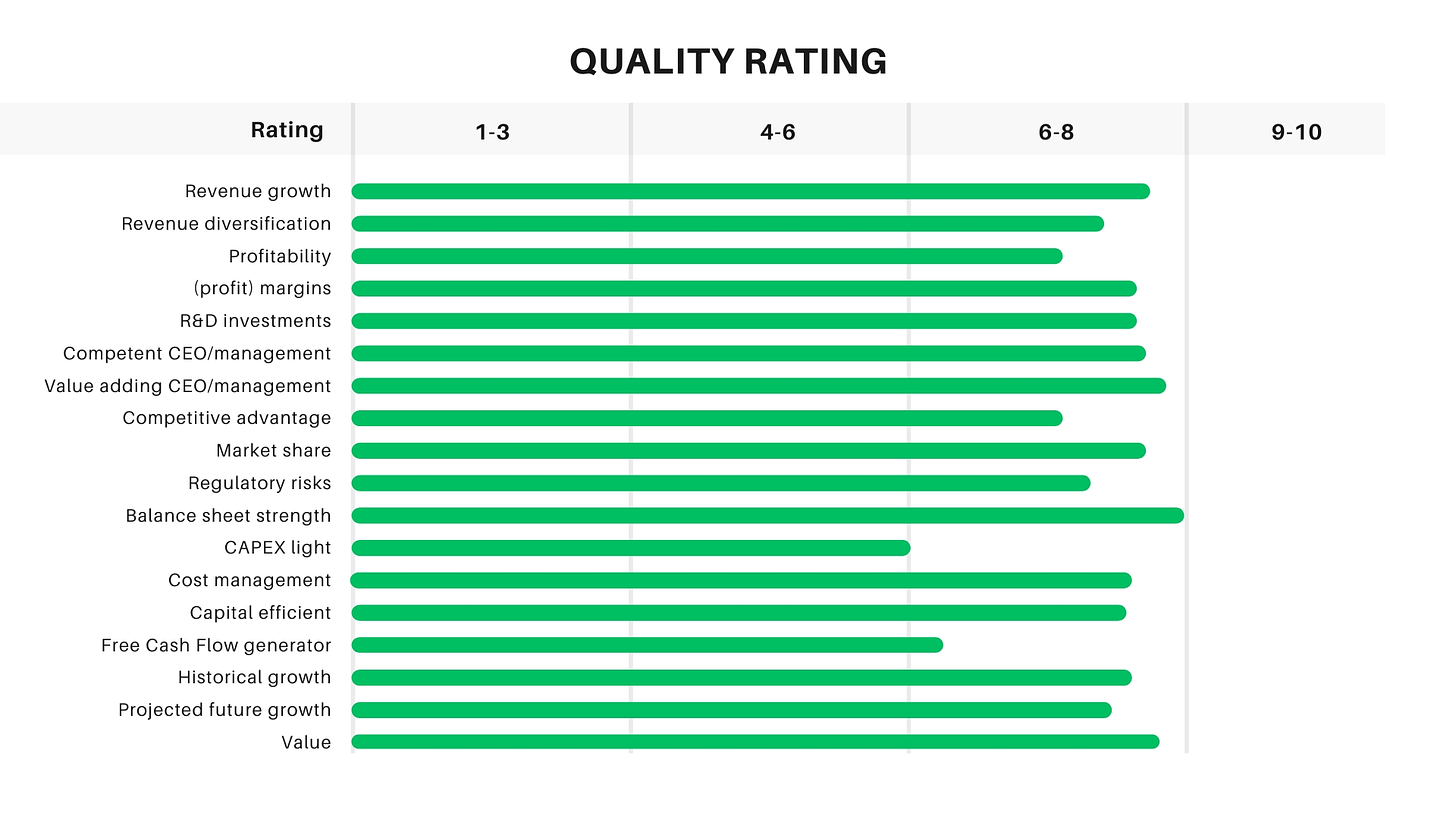
12. Quality Rating
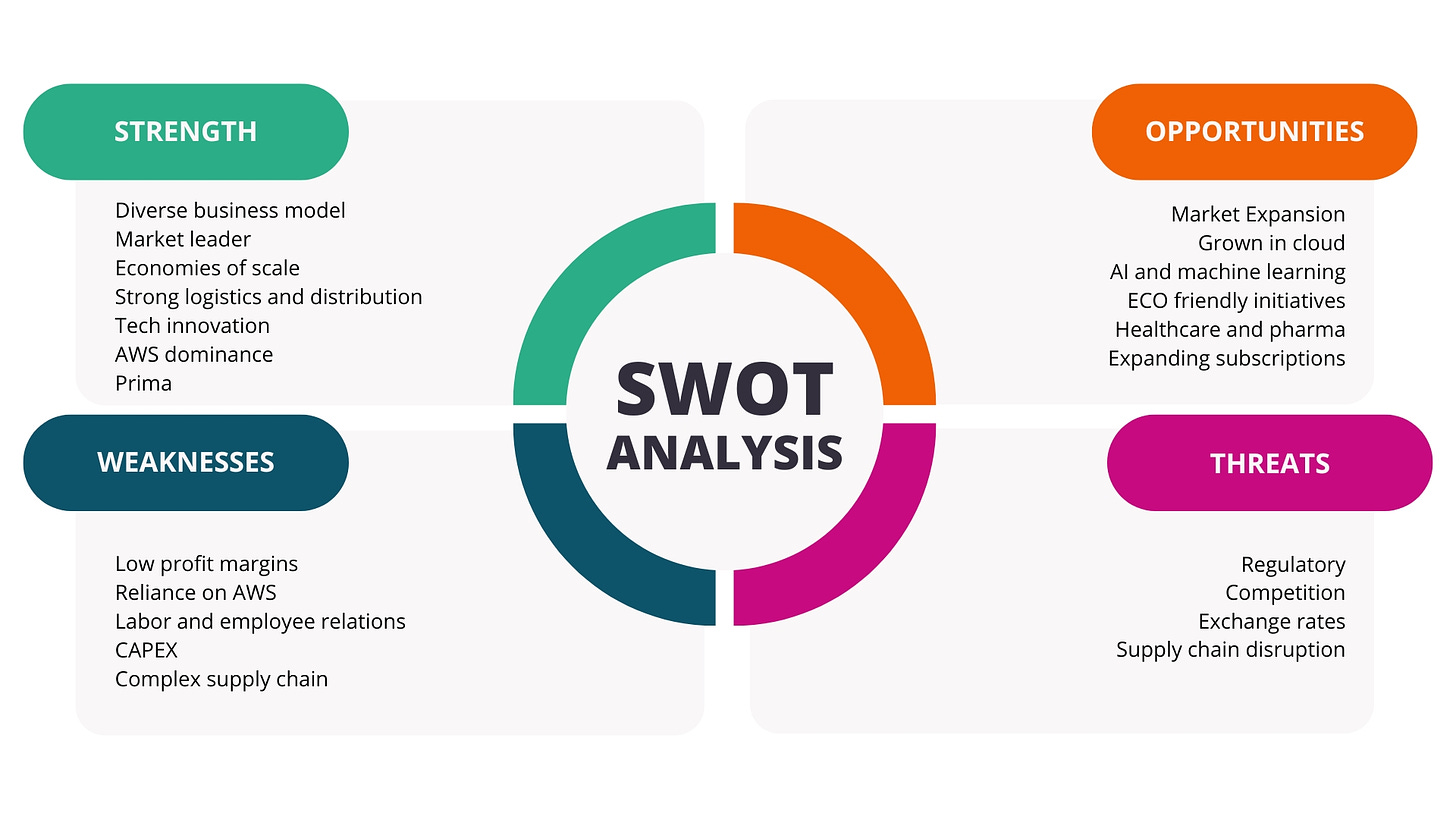
13. SWOT Analysis
14. Valuation Assessment
Let us crunch some numbers!
DCF: $365,24 (Yes, DCF in the case of Amazon is questionable due to CAPEX, still doing it)
Multiple Valuation: $192,45
Benjamin Graham’s Valuation: $197,09
Analysts Average: $225,46
Average of: $245,05
Current Price: $189,34
If we compare the average of the four valuations to Amazon’s current price, Amazon looks undervalued.
Let me know what you think by leaving a comment!
To help me improve my deep dive, please leave a rating!
End note
Thank you for reading this investment case on Amazon!
With every investment case, I am trying to improve my writing and how I communicate my findings with you all. Because I started not too long ago, some posts might change in layout or other aspects before I find the layout that suits my best wishes; sorry in advance.
As of now, thank you so much for your time! I hope you found some valuable information in this investment case.
Disclaimer
I own Amazon shares, which account for roughly 14% of my portfolio. I intend to buy more shares within three to six months.
By reading my posts, being subscribed, following me, and visiting my Substack, you agree to my disclaimer. You can read the disclaimer here.


