Hey there, partner! 👋
Before we dive in, I need your support to keep these articles FREE.
If you're enjoying this content, here's how you can help:
Like the article
Please share it on your social media
Comment below to join the conversation
Your engagement means everything. Thanks for being part of the journey! Now, let's get started.
Welcome back to another deep dive into the world of investments. Today, we’re shifting gears to analyze Lululemon—the reigning titan of the activewear industry.
If you’re new here or missed my previous articles, feel free to catch up:
If you haven’t already, hit that follow button for FREE insights to fuel your investment journey. Whether you’re just starting or a seasoned investor, there’s something here for everyone.
Once you’ve finished this analysis, I’d love to hear your thoughts! Be sure to comment, drop a like, and share it with your Substack community if this resonates with you. Your support makes all the difference! 😊
Table of contents
Corporate Analysis
1.1 Business Overview
1.2 Revenue BreakdownExecutive Leadership
2.1 CEO Experience
2.2 Employee Satisfaction Ratings
2.3 CEO Value CreationCompetitive and Sustainable Advantages (MOAT)
Industry Analysis
4.1 Current Industry Landscape and Growth Prospects
4.2 Competitive LandscapeRisk Assessment
Financial Stability
6.1 Asset Evaluation
6.2 Liability AssessmentCapital Structure
7.1 Expense Analysis
7.2 Capital Efficiency ReviewProfitability Assessment
8.1 Profitability, Sustainability, and Margins
8.2 Cash Flow AnalysisGrowth Analysis
9.1 Historical Growth Trends
9.2 Future Growth ProjectionsValue Proposition
10.1 Dividend Analysis
10.2 Share Repurchase Programs
10.3 Debt Reduction StrategiesFuture Outlook
Quality Rating
SWOT Analysis
Valuation Assessment
Conclusion
1. Corporate Analysis
Lululemon Athletica Inc., together with its subsidiaries, designs, distributes and retails athletic apparel and accessories for women and men. It operates in two segments: company-operated stores and direct-to-consumer stores. The company offers pants, shorts, tops, and jackets for healthy lifestyles and athletic activities, such as yoga, running, training, and other sports. It also provides fitness-related accessories and footwear. The company sells its products through a chain of company-operated stores; outlets and warehouse sales; interactive workout platform; a network of wholesale accounts, such as yoga studios, health clubs, and fitness centers; temporary locations; and license and supply arrangements, as well as directly to consumer through mobile apps and lululemon.com e-commerce website. As of January 30, 2022, it operated 574 company-operated stores under the Lululemon brand in the United States, Canada, the People's Republic of China, Australia, the United Kingdom, Japan, New Zealand, Germany, South Korea, Singapore, France, Malaysia, Sweden, Ireland, the Netherlands, Norway, and Switzerland. Lululemon Athletica Inc. was founded in 1998 and is based in Vancouver, Canada.
1.2 Revenue Breakdown
Lululemon’s primary revenue drivers are as follows:
Men’s Product Revenue
Lululemon’s men’s product line includes activewear designed for performance and comfort. This segment covers a variety of items, such as athletic shorts, pants, tops, and accessories.
Products: Shorts, pants, t-shirts, polos, outerwear, accessories.Women’s Product revenue
This is Lululemon’s largest revenue driver, representing the sales of women’s activewear and related products. Key categories include leggings, sports bras, tops, jackets, and accessories for athletic and lifestyle purposes.Products: Leggings, sports bras, tanks, jackets, shorts, and accessories.
Other Products Revenue
This includes revenue from categories outside men’s and women’s core product lines, such as footwear, bags, yoga mats, and self-care products. It also includes collaborations and limited-edition collections that complement Lululemon’s apparel offerings.
Products: Footwear, bags, yoga mats, water bottles, self-care products.
Lululemon is a sports brand. We expect its main revenue driver to be the sporting items it sells for men and women.
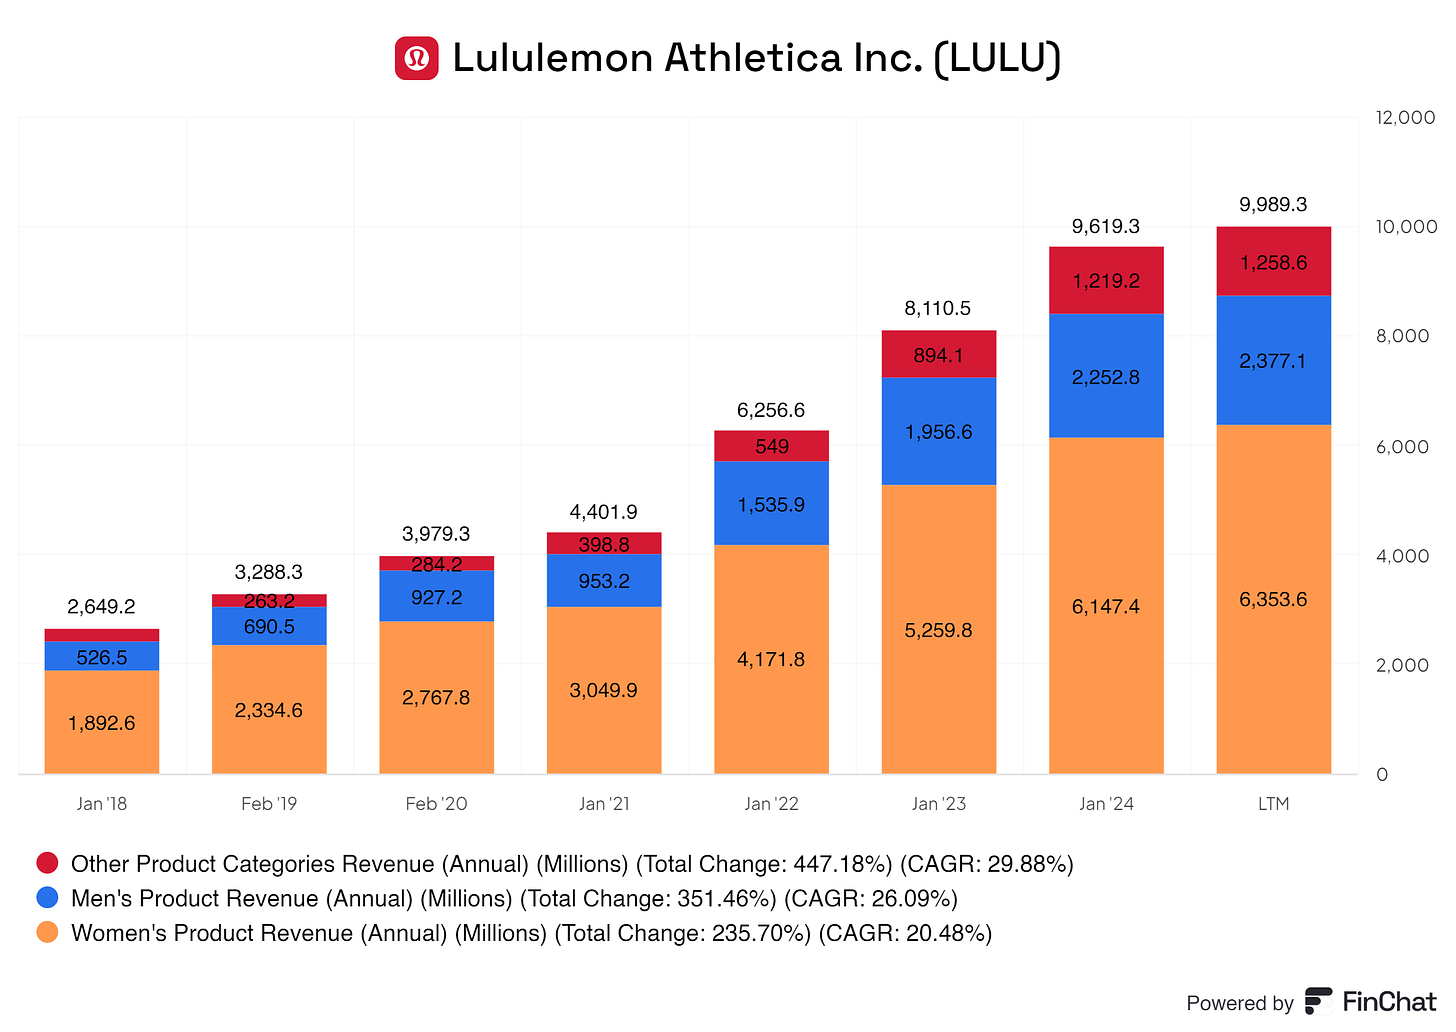
Lululemon's core consumers are women, although a slight shift is visible. In 2017, 71.44% of Lululemon sales came from women. YoY, women are still generating more revenue, but men are also participating in the game. Men accounted for 19.87% in 2017. Currently, men account for 23.80% of Lululemon’s revenue. This shows that Lululemon can attract more women but is also starting to attract more men. Women are wonderful customers to have. Women tend to spend more and on a more regular basis. Women tend to be more impulsive when they’re shopping for clothing. In addition, women are YoY spending more on clothing. in 2018, the average woman spent roughly $80 weekly on new clothing. In 2023, as shown in recent studies, women tend to pay roughly $98 per week for clothing. There is a significant increase in spending for the average woman in America.
Men are a more difficult target audience for clothing brands; I can speak from experience. Men tend to be more frugal regarding clothing and wear an item out before purchasing a new item. Even though there’s a significant difference between women and men, Lululemon can attract both men and women and continues to upsell correctly to its customers.
We see that Lululemon has a modest demographic difference between men and women. In the last twelve months, men accounted for 23.80%, with a CAGR of 2.61%, while women accounted for 63.60%.
Although women's product revenue seems to be shrinking, men are entering the game if we look at the percentages. Women’s product revenue is still growing with a CAGR of 20.48%, men’s product revenue is growing with a CAGR of 26.09%, and other product revenue is growing by 29.88% (all since 2018). We see exceptional growth in all categories for Lululemon. These types of CAGRs are not common for a clothing brand. If we look at Nike (TICKER: $NKE), we see that their highest CAGR is on their footwear revenue, 7.33%. Yes, Lululemon hasn’t been in business as long as Nike, but these CAGRs are still unheard of in the clothing business. If we look at other brands, we see scarcity in CAGRs above 10%, even in younger businesses. This shows there is some hidden potential for Lululemon.
(Yes, there can be men out there buying female clothing. For simplicity, I will uphold that men only buy men's clothing, and vice versa for women)
Let us dive into the global diversification of Lululemon.
One thing is clear for Lululemon: their customers are primarily from The United States, Canada, and Mexico (America = generally USA, Canada, and Mexico). I’m not a big fan that roughly 75% to 80% of Lululemon’s revenue comes from this demographic. In a worst-case scenario, if these segments take headwinds, Lululemon’s overall total revenue will suffer extreme backlash. In an ideal situation, we would like to see all segments as a significant portion of the total revenue in case of economic downturns.
But rest assured, Lululemon is focused on international growth. Lululemon’s 2023 annual report said the following:
As we have further executed on our omni-channel retail strategy, and continued to expand our operations in international markets, our performance reviews and resource allocation decisions have evolved to be made on a regional market basis.
Increasing its brand name globally is extremely important for Lululemon's future. I am glad Lululemon knows this, too; the CEO said the following about international (and product) growth:
We remain committed to our Power of Three ×2 growth plan, which is grounded in our goals to double our men’s business, double our digital business, and quadruple our international business
This tells us that management knows where to strike and has a solid plan set out for growth.
2. Executive Leadership
2.1 CEO Experience
Lululemon's CEO has been in their position since August 2018, currently serving for 6 years and 3 months, based in Vancouver, Canada.
In addition to their role at Lululemon, they have been members of the Walt Disney Company's Board of Directors since May 2021, serving for 3 years and 6 months.
Before joining Lululemon, they served as President and CEO of Sephora Americas from October 2013 to August 2018, a role they held for 4 years and 11 months in the San Francisco Bay Area.
Before Sephora, they were President and CEO of Sears Canada from July 2011 to September 2013, working in this capacity for two years and three months in the Toronto, Canada, Area.
They also held the position of EVP of the Conventional Food Division at Loblaw Companies Limited from April 1994 to June 2011, serving for 17 years and 3 months in Mississauga.
Regarding their education, they earned a Master of Business Administration (MBA) from the University of Toronto - Rotman School of Management, attending from 1998 to 2000. Before that, they completed a Bachelor of Science (BS) at Western University from 1990 to 1994.
2.2 Employee Satisfaction Ratings
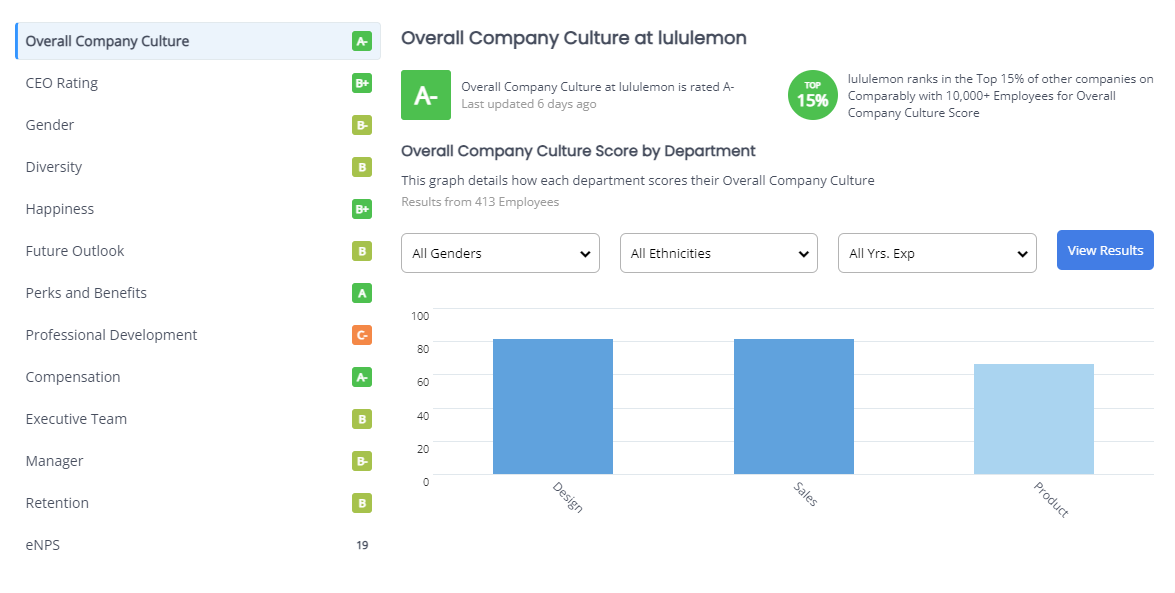
Glassdoor shows us an extremely positive rating for the CEO, Calvin McDonald. Roughly 83% of the reviews from (ex) employees say that they would recommend Calvin. That’s an incredible score for Calvin!
On Comparable, Lululemon scores well, except for a C- on Professional Development.
Overall, Lululemon and the CEO score above average compared to Nike, Under Armour, and other competitors. Their ratings on Comparable are similar, except for the CEO rating on Glassdoor. Lululemon takes the cake.
2.3 CEO Value Creation
A wonderful track record for Calvin, but does Calvin create value for its shareholders?
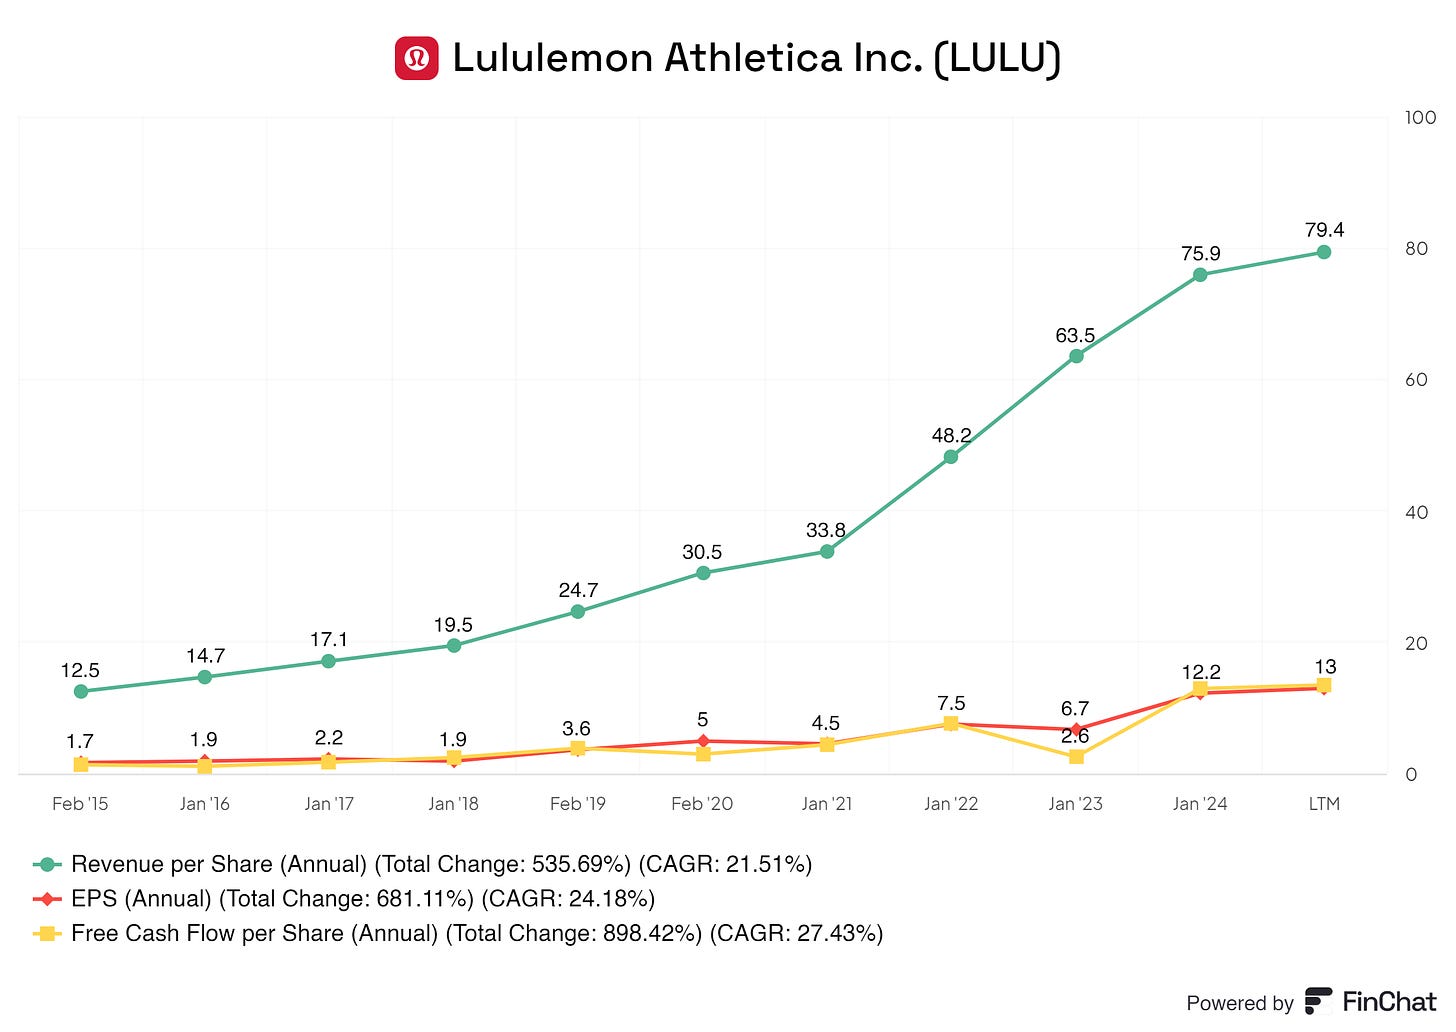
He does! We can see a clear trend in earnings per share, revenue per share, and free cash flow per share. This creates value for the business and Lululemon shareholders.
3. Competitive and Sustainable Advantage (MOAT)
So, a MOAT can be in either one or more of the following forms:
Brand Power
Patents
Scale and Cost Advantages
Switching Costs
Network Effect
Attracting Talent (I consider this a MOAT, others don’t. Decide for yourself)
Brand Power
While Lululemon may not rely heavily on patents, the company does emphasize innovative product development. It invests in proprietary fabric technologies (such as Luon and Nulu) that differentiate its products from competitors in terms of comfort, performance, and style.
Patents
While Lululemon may not rely heavily on patents, the company does emphasize innovative product development. It invests in proprietary fabric technologies (such as Luon and Nulu) that differentiate its products from competitors in terms of comfort, performance, and style.
Scale and Cost Advantages
Lululemon's established retail network and growing global presence give it scale advantages. While it competes in a high-margin space, its expanding direct-to-consumer (DTC) model through online sales further increases its profitability by cutting distribution costs.
Switching Costs
Lululemon's loyal customer base, combined with its proprietary fabric technology and brand strength, creates a form of switching cost. Customers who value the brand's quality, comfort, and style may find it difficult to switch to other brands that don’t meet their specific expectations.
Network Effect
Lululemon has cultivated a community through its in-store yoga classes, online content, and ambassador programs. These initiatives build a network of customers who associate their fitness routines with Lululemon, reinforcing the brand's appeal and driving engagement.
Attracting Talent
Lululemon is recognized for its strong corporate culture and ability to attract top talent, particularly in design, product innovation, and leadership. The company's ethos around mindfulness and well-being appeals to employees, creating an environment that fosters creativity and growth.
We believe one of our competitive advantages is our ability to consistently bring newness and innovation into our assortment, and that our proprietary fabrics, innovative designs, and functional technology set us apart. With our focus on feel, functionality, fit, and versatility, people of all ages and backgrounds can see themselves in lululemon - Calvin McDonald
4. Industry Analysis
4.1 Current Industry Landscape and Growth Prospects
The global sports apparel market was worth roughly $200.56 billion in 2022 and is predicted to grow to roughly $332.93 billion by 2030, a CAGR of roughly 6.54% between 2022 and 2030.
The global sports apparel market is poised for growth, primarily due to increasing investments in the broader sports industry. Over the past 20 years, large-scale sporting events have garnered a significant following, with more people becoming avid sports fans worldwide. These events are viewed as opportunities to foster community spirit among spectators. Furthermore, the rapid commercialization of the sports sector has accelerated, with both regional governments and private entities capitalizing on this burgeoning industry.
For example, the Gulf region has seen a notable rise in sports-related investments as local governments seek to diversify their economies beyond the oil sector, which has experienced declining growth. Qatar's hosting of the 2022 FIFA World Cup, which invested nearly USD 220 billion in the event, is a prominent case in point. Saudi Arabia is also a key player in sports investments, contributing to the growing demand for sports apparel.
Growing Sports Participation in Educational Institutions and New Sports Facility Developments Fuel Market Expansion
The impact of professional sports on regional economies is significant, but the influence also extends to local communities. Recognizing the developmental benefits of sports for children, educational institutions are increasingly incorporating sports and recreational activities into their programs. Regional governments also support constructing state-sponsored sports facilities to nurture underprivileged yet talented athletes.
For instance, in December 2023, Australia's Bega Valley Shire Council discussed building a new sports complex with Monarch Building Solutions, which is expected to positively impact the global sports apparel market.
Challenges in the Sports Apparel Market: High Costs of Premium Products
One of the main limitations to growth in the sports apparel market is the high price of top-quality products. Premium and performance-oriented sports apparel often come with a hefty price tag, while lower-quality alternatives tend to degrade quickly, especially under tough conditions.
For example, a football jersey from a popular club can cost over USD 100, making it inaccessible for many consumers. The apparel made for professional athletes is even more costly, further restricting the market’s growth potential.
Opportunities in the Sports Apparel Market: Technological Advancements in Production
Innovation in sports apparel production presents a significant growth opportunity for the market. Manufacturers are increasingly investing in advanced technologies to enhance the functionality of sportswear. This trend extends beyond production to include branding, design, and the incorporation of smart technology in fabrics.
In November 2023, Nike, a leading player in the sports apparel industry, introduced Nike ReactX technology, which powers its new Infinity React shoe line. After five years of development, the foam used in these shoes is designed to maximize energy return, boosting player performance. Similarly, in November 2022, Asics launched the ASICS x Solana UI Collection, featuring customized GT-2000™ 11 running shoes and accompanying non-fungible tokens (NFTs) to engage the Web3 community.
Environmental Challenges Facing the Sports Apparel Market
The sports apparel industry significantly contributes to environmental pollution, particularly through textile waste. The increasing consumer demand for sportswear results in substantial waste generation, as many items are discarded after a short period of use.
Approximately 11 million tons of textile waste are generated annually in the United States alone. Addressing this issue and creating a circular economy should be key priorities for industry leaders.
Segmentation of the Sports Apparel Market
The global sports apparel market is segmented by end-user, material, sports type, and region.
The market is divided into professional and amateur categories by end-user. In 2022, the amateur segment witnessed the highest growth due to its broad consumer base, which includes aspiring athletes, students, and general sports enthusiasts. This growth is fueled by an increasing focus on physical fitness among the general population. As of May 2023, Nike operated over 1,020 stores globally. The professional segment also plays a crucial role, as producing sports apparel for professional athletes requires significant investment.
In terms of material, the market is segmented into synthetic and natural categories.
The market includes cricket, football, baseball, basketball, hockey, and others by sports type. In 2022, the football segment led the market due to the sport's immense global popularity. With over 3.49 billion followers worldwide, football remains a major sales driver in the sports apparel market, with jerseys from clubs like Manchester United and Barcelona being among the highest-selling worldwide.
4.2 Competitive Landscape
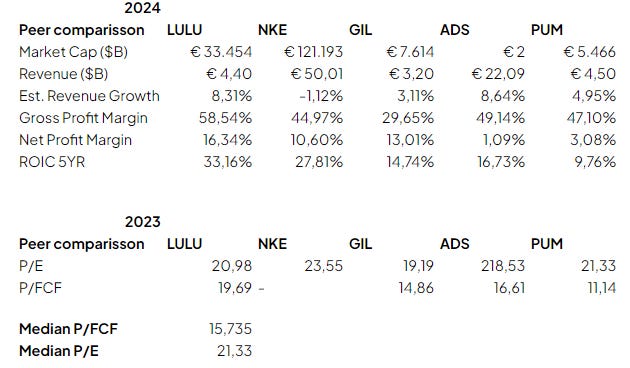
I identify Puma, Nike, Gildan Active Wear, Adidas, and Puma as Lululemon’s main competitors in the activewear sector.
Lululemon stands out among its peers in the apparel industry with impressive profitability and strategic growth, setting itself apart in a highly competitive market. When compared to its key competitors like Nike, Gildan, Adidas, and Puma, Lululemon's market positioning reflects its unique approach to brand strength, operational efficiency, and business strategy.
In 2024, Lululemon's market capitalization of €33.45 billion positions it as a major player, though it trails significantly behind Nike, the industry leader, with a massive €121.19 billion. However, while Nike commands a larger revenue base of €50.01 billion compared to Lululemon’s €4.40 billion, Lululemon differentiates itself with a stronger focus on profitability and premium margins.
Lululemon’s estimated revenue growth of 8.31% outshines competitors like Nike, which faces a revenue decline of -1.12%, and even stands strong against Adidas (8.64%) and Puma (4.95%). Lululemon’s gross profit margin of 58.54% significantly surpasses its competitors, with Nike at 44.97% and Adidas at 49.14%, demonstrating Lululemon’s ability to command premium pricing and efficiently manage production costs.
Moreover, Lululemon’s net profit margin of 16.34% is an impressive display of its profitability compared to Nike’s 10.60% and Adidas’ significantly lower 1.09%. Gildan, with a net profit margin of 13.01%, is one of the few companies approaching Lululemon’s level of profitability, yet it operates in a different market segment with lower pricing power.
Lululemon’s Return on Invested Capital (ROIC) over five years, at 33.16%, highlights its exceptional capital efficiency, far ahead of Nike’s 27.81%, Gildan’s 14.74%, and Puma’s modest 9.76%. This demonstrates Lululemon’s ability to generate substantial investment returns, capitalizing on its brand strength and lean operational model.
In terms of valuation, Lululemon also sets itself apart. In 2023, its Price-to-Earnings (P/E) ratio stood at 20.98, which, while lower than Adidas’ exorbitant 218.53, reflects the market’s confidence in Lululemon’s stable growth trajectory. Similarly, its Price-to-Free Cash Flow (P/FCF) ratio of 19.69 is higher than Puma’s 11.14 and Gildan’s 14.86 but significantly lower than Adidas’, reinforcing Lululemon’s position as a premium brand with strong future cash flow generation potential.
Lululemon’s solid profitability, strong growth, and superior return on investment make it a standout in the apparel sector. It continues to attract investor confidence despite operating alongside much larger revenue-generating companies like Nike.
We believe we successfully compete on the basis of our premium brand image and our technical product innovation. We also believe our ability to introduce new product innovations, combine function and fashion, and connect through in-store, online, and community experiences sets us apart from our competition. - Annual Report 2023
5. Risk Assessment
Market Saturation and Increasing Competition
Risk: As the athleisure market continues to grow, Lululemon faces increased competition from established brands like Nike and Adidas and newer entrants expanding their presence in this space. Mass-market brands like Under Armour and more niche boutique labels are also vying for market share in the premium activewear segment.
Impact: Heightened competition could pressure pricing, reducing Lululemon's margins. Moreover, as competitors innovate with new product lines or expand aggressively into international markets, Lululemon may struggle to maintain its market leadership, particularly in regions with less brand recognition.
Mitigation: Lululemon should continue differentiating its product offerings by focusing on quality, performance, and lifestyle appeal. By innovating with new fabrics and sustainable production methods and expanding its men’s and international collections, Lululemon can protect its premium positioning and grow its market share.
Supply Chain Disruptions and Cost Pressures
Risk: As Lululemon scales its operations globally, it is exposed to potential supply chain disruptions, including shipping delays, rising raw material costs, and factory shutdowns due to external factors like pandemics or geopolitical tensions. Reliance on specific materials, such as technical fabrics, also leaves the company vulnerable to material availability and cost fluctuations.
Impact: Supply chain disruptions or significant increases in material costs could lead to delays in product launches, higher production costs, and reduced profitability. Lululemon's margins may be squeezed if the company cannot pass these increased costs on to consumers.
Mitigation: To ensure stability, Lululemon should diversify its supplier base and establish long-term agreements with key material providers. Investing in local production capabilities in critical markets and optimizing inventory management could mitigate these risks.
Regulatory and Sustainability Risks
Risk: Increasing regulatory scrutiny around environmental sustainability, particularly in the fashion industry, may affect Lululemon. Governments and regulators may impose stricter sustainability requirements, such as limitations on emissions or mandatory use of eco-friendly materials, which could add compliance costs or restrict certain manufacturing processes.
Impact: If Lululemon cannot meet these regulations or adapt quickly, it could face reputational damage, penalties, or increased operational costs. Consumers may also shift their loyalty to more sustainably focused brands if Lululemon is perceived as falling behind in environmental commitments.
Mitigation: Lululemon has already taken steps toward sustainability, such as introducing its "Impact Agenda," targeting responsible sourcing and eco-friendly production. It should continue to invest in sustainable innovation, including recycled materials, and engage in proactive compliance to stay ahead of regulatory changes.
Technological and Retail Innovation Risks
Risk: As consumer shopping behavior shifts toward e-commerce, Lululemon must adapt its business model to remain competitive. Failure to innovate digitally, improve the online shopping experience, or integrate technology into its products (e.g., wearables and fitness apps) could hurt its growth potential. Additionally, physical retail spaces may lose relevance if they do not provide unique, experiential elements.
Impact: If Lululemon does not adequately invest in its digital transformation or expand its omnichannel capabilities, it risks losing market share to more tech-savvy competitors. Retail stores could experience declining foot traffic if they fail to create engaging in-person experiences.
Mitigation: Lululemon should continue enhancing its digital presence through e-commerce, mobile apps, and social media. Additionally, the company’s focus on experiential retail, such as community-building events and fitness classes in-store, can keep its physical locations relevant and drive customer loyalty.
Global Economic Risks
Risk: Lululemon's premium pricing strategy makes it susceptible to economic downturns, especially in key markets like North America and Europe. High inflation, rising interest rates, or a global recession could reduce consumers' discretionary spending, affecting demand for non-essential goods like Lululemon's athletic wear.
Impact: Economic challenges could slow sales growth and lead to inventory overstock or markdowns, hurting profitability. Additionally, currency fluctuations in international markets could impact Lululemon's revenue and margins.
Mitigation: To mitigate these risks, Lululemon should diversify its geographic revenue streams by expanding into emerging markets with growing middle-class consumers. Maintaining a strong balance sheet and disciplined cost management can also help Lululemon navigate economic fluctuations.
Dependence on Brand Identity and Executive Leadership
Risk: Lululemon’s brand is closely tied to its identity as a premium, community-driven company and to its leadership team, which has driven its innovation and expansion. Any shifts in leadership or dilution of its brand message could impact its market position.
Impact: A loss of consumer trust in Lululemon’s brand or a leadership transition could decrease customer loyalty and investor confidence. Over-reliance on its current brand positioning without evolving to new consumer trends may hinder long-term growth.
Mitigation: Lululemon should continue investing in its brand, focusing on evolving its lifestyle appeal while maintaining core values. The company should also ensure strong succession planning and leadership development to maintain stability during executive transitions.
6. Financial Health
6.1 Assets Assessment
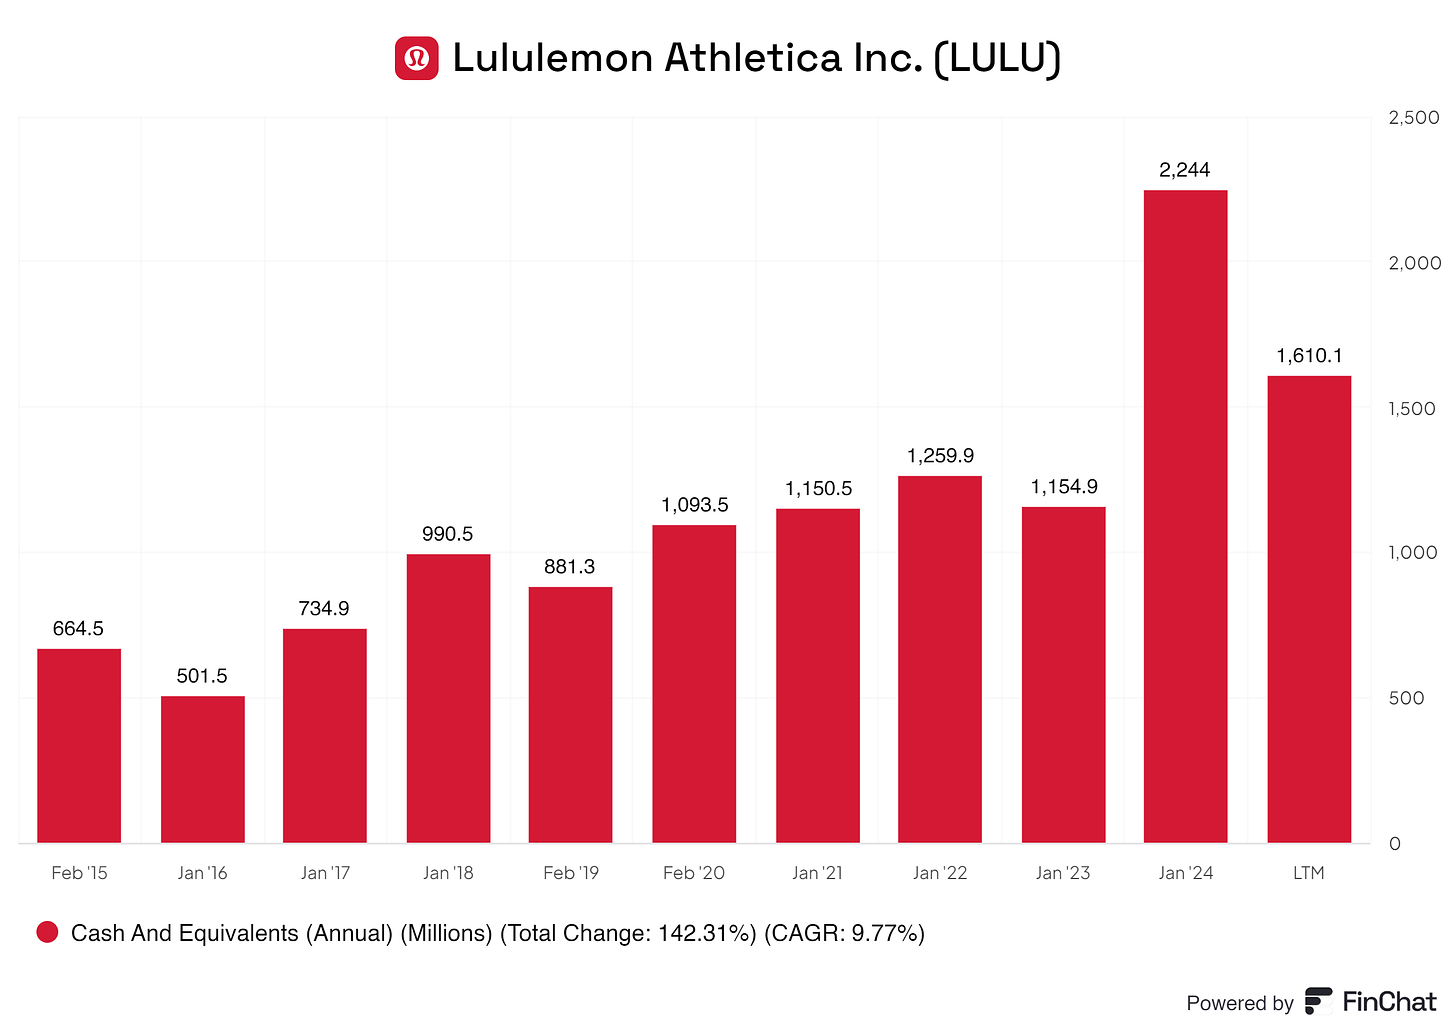
Many of you already know that I am a huge fan of businesses with an increasing cash position. Lululemon is one such business.
Lululemon has a steadily growing cash position. These types of solid cash positions can be used to cover operating expenses, CAPEX, debt repayment, dividends, or as a reserve. In my honest opinion, it is crucial that a business (of any sort) has a solid cash position as a reserve or for other needs. Being highly liquid allows a company to continue running smoothly, even when the economic environment is not favorable for the business.
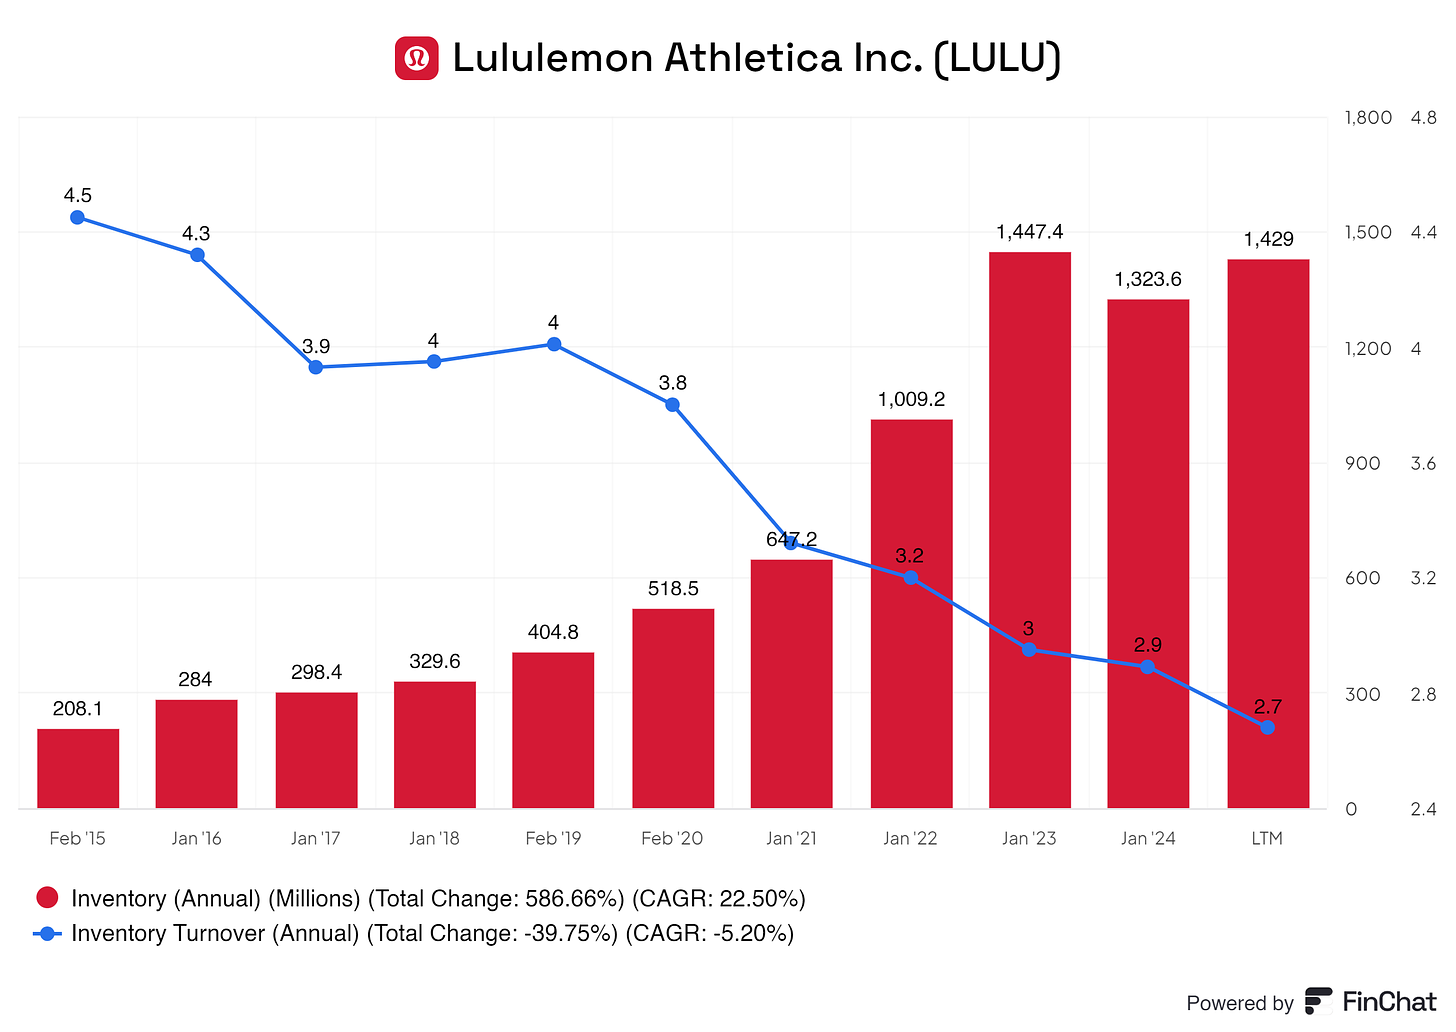
What might cause some ‘‘concern’’ is the inventory of’s take a closer look at it.
The chart provides a detailed view of Lululemon inventory levels and turnover from 2015 to the most recent period. Over the years, Lululemon has experienced a significant increase in its inventory levels, growing from $208.1 million in February 2015 to $1,429 million in the most recent period. This represents a remarkable growth of 586.66% in total inventory over the period, with a compound annual growth rate (CAGR) of 22.50%. Such a consistent rise suggests that Lululemon has been scaling its operations, increasing product offerings, expanding into new markets, and potentially preparing for higher demand. The inventory growth likely reflects the company’s ambitions to support its expanding global footprint and broaden its product categories.
At the same time, the company's inventory turnover has been steadily declining over the same period. Inventory turnover, a key metric that measures how often the company sells and replaces its stock within a given timeframe, has dropped from 4.5 in February 2015 to 2.7 in the latest period. This total decrease is 39.75%, with a CAGR of -5.20%. A declining inventory turnover can be concerning, as it indicates that Lululemon is holding onto its inventory for longer periods, possibly due to slower sales or the company stockpiling more inventory than it can sell promptly.
This trend of rising inventory levels coupled with declining turnover raises important considerations. On the one hand, the increase in inventory suggests that Lululemon is preparing to meet increased consumer demand or manage potential supply chain disruptions. However, the declining turnover could point to potential inefficiencies, where the company might not be selling through its stock as quickly as it used to. If Lululemon continues to hold higher inventory levels without accelerating its sales, it could face challenges such as overstocking, leading to markdowns, lower profit margins, or even inventory write-offs.
In conclusion, while Lululemon's rising inventory reflects its growth and preparation for future demand, the decline in inventory turnover suggests that the company may need to improve its inventory management. Ensuring that inventory levels are balanced with sales growth will be crucial to maintaining profitability and avoiding the potential pitfalls of overstocking. The company may need to optimize its supply chain, forecast demand more accurately, and align its inventory strategy with sales performance to enhance operational efficiency.
Lululemon’s management should keep track of its inventory. Although not much growth is expected, Lululemon is stocking inventory like tremendous amounts of growth are expected.
Besides these points, the assets sheet is looking solid!
6.2 Liabilities Assessment
Most of Lululemonst's liabilities sheet is filled with leases (which I do not consider a liability, but they’re there) and accrued expenses. These expenses are nothing to worry about. Accrued expenses are costs or liabilities a company has incurred but has not yet paid or recorded in its financial statements by the end of a specific accounting period. These expenses are recognized under the accrual accounting method, which matches expenses to the period they were incurred, regardless of when the actual payment is made.
In simpler terms, accrued expenses represent obligations a company owes but has not yet settled. They are recorded in the financial statements as current liabilities on the balance sheet because they typically need to be paid within a short time frame, usually within a year.
Wages and Salaries Payable: If employees have worked but have not been paid by the end of the accounting period, their wages are considered accrued expenses.
Interest Payable: Interest on loans that have accumulated but not yet been paid by the company is recorded as an accrued expense.
Utilities Payable: A company may incur utility costs (such as electricity or water) throughout a month, but if the bill has not yet been received or paid by the end of the period, the cost is accrued.
Rent Payable: If rent is owed for the current period but has not yet been paid, it would be recorded as an accrued expense.
These expenses are nothing compared to Lululemon’s cash position and operational cash flow, making it not worth discussing or worrying about. Lululemon possesses a healthy balance sheet with nothing to look out for.
7. Capital Structure
7.1 Expense Analysis
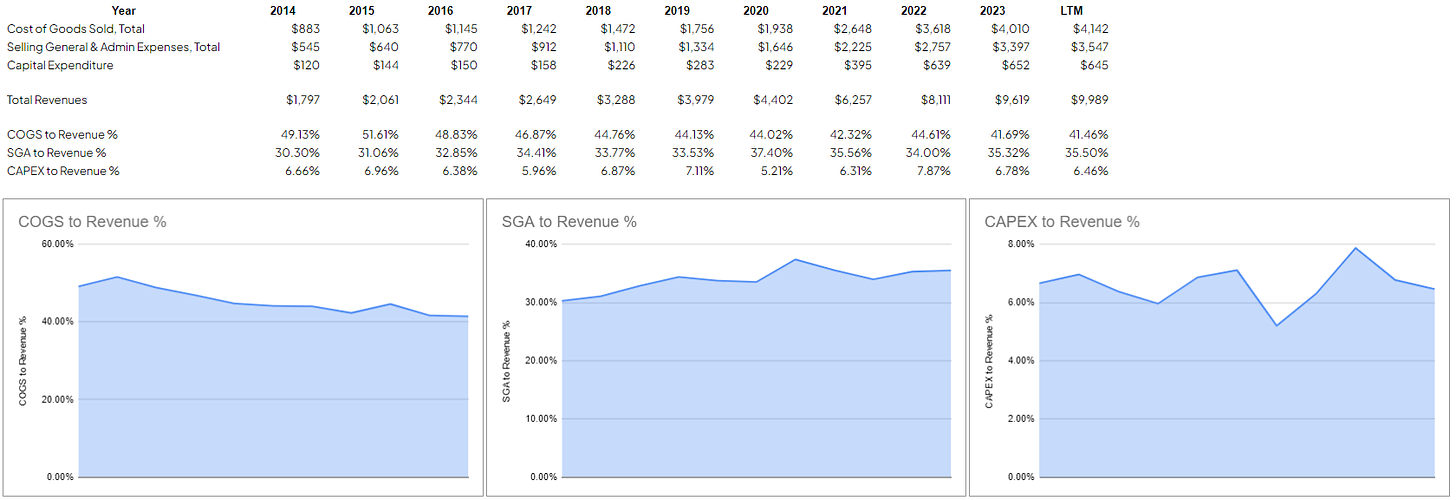
The chart clearly shows Lululemon Athletica Inc.’s financial performance over several years, focusing on key metrics such as total revenue, Cost of Goods Sold (COGS), Selling, General, and Administrative (SG&A) expenses, and capital expenditures (CAPEX). From 2014 to the Last Twelve Months (LTM), Lululemon has experienced significant revenue growth alongside varying trends in its operational costs.
Revenue has shown a strong upward trajectory, rising from $1.797 billion in 2014 to $9.989 billion in LTM. This growth reflects Lululemon’s expansion, likely driven by product diversification, increased store openings, and growing consumer demand for its premium athleisure products. The company’s ability to scale revenues at such a pace suggests effective brand management and strong customer loyalty, key elements of its success.
The Cost of Goods Sold (COGS) also increased significantly, from $883 million in 2014 to $4.142 billion in LTM. However, the more important observation is how COGS as a percentage of revenue has improved over time. In 2014, COGS represented 49.13% of revenue, but by LTM, this figure had dropped to 41.46%. This decrease indicates that Lululemon has been able to produce and deliver its products more efficiently, improving its gross margins. Whether through better sourcing of materials, more efficient manufacturing processes, or effective cost management in its supply chain, the company spends less per dollar of revenue on producing its goods.
The Selling, General, and Administrative (SG&A) expenses have grown from $545 million in 2014 to $3.547 billion in LTM. As a percentage of revenue, SG&A costs rose from 30.30% in 2014 to a peak of 37.40% in 2020 before stabilizing to 35.50% in LTM. While the increase in SG&A as a percentage of revenue is not an ideal trend, it reflects the higher costs associated with scaling a global retail operation, such as marketing expenses, store operations, and employee salaries. However, Lululemon has kept SG&A relatively stable in recent periods, which is a positive signal that they are managing operational costs better despite their significant growth.
Capital expenditures (CAPEX), the investment Lululemon makes into its infrastructure, such as stores, distribution centers, or technological advancements, has fluctuated, rising from $120 million in 2014 to $645 million in LTM. As a percentage of revenue, CAPEX has remained relatively stable, generally fluctuating between 6% and 7%, indicating that the company continues to invest in its growth at a consistent rate.
What is Improving:
The most notable improvement is in the COGS to revenue percentage, which has declined steadily over the years. This reflects a growing ability to produce and sell products more efficiently, resulting in higher gross margins. Lowering COGS as a percentage of revenue is a clear indicator that Lululemon is controlling production costs well, which can be attributed to economies of scale, improved operational efficiency, or better cost management in their supply chain.
Areas to Monitor:
While Lululemon’s revenue growth and COGS management are positive, some areas could pose challenges. The SG&A percentage of revenue has been relatively high compared to earlier years. This suggests that as Lululemon has grown, the costs associated with expanding operations—such as marketing, administration, and store management—have increased disproportionately. Lululemon should improve operating efficiency to ensure these costs do not exceed profits. Additionally, CAPEX to revenue remains relatively stable but relatively high, suggesting that Lululemon is making consistent investments in its infrastructure. However, these investments should be carefully managed to ensure they are driving growth and not unnecessarily inflating expenses.
Overall Insight:
Lululemon has demonstrated significant growth, and its improvement in managing COGS is a strong indicator of increased profitability potential. However, managing its SG&A expenses will be crucial to ensure operational costs do not undermine profitability as the company continues to scale. In the longer term, balancing its aggressive investment strategy (CAPEX) with continued revenue growth will be key to sustaining its positive financial trajectory.
7.2 Capital Efficiency Review
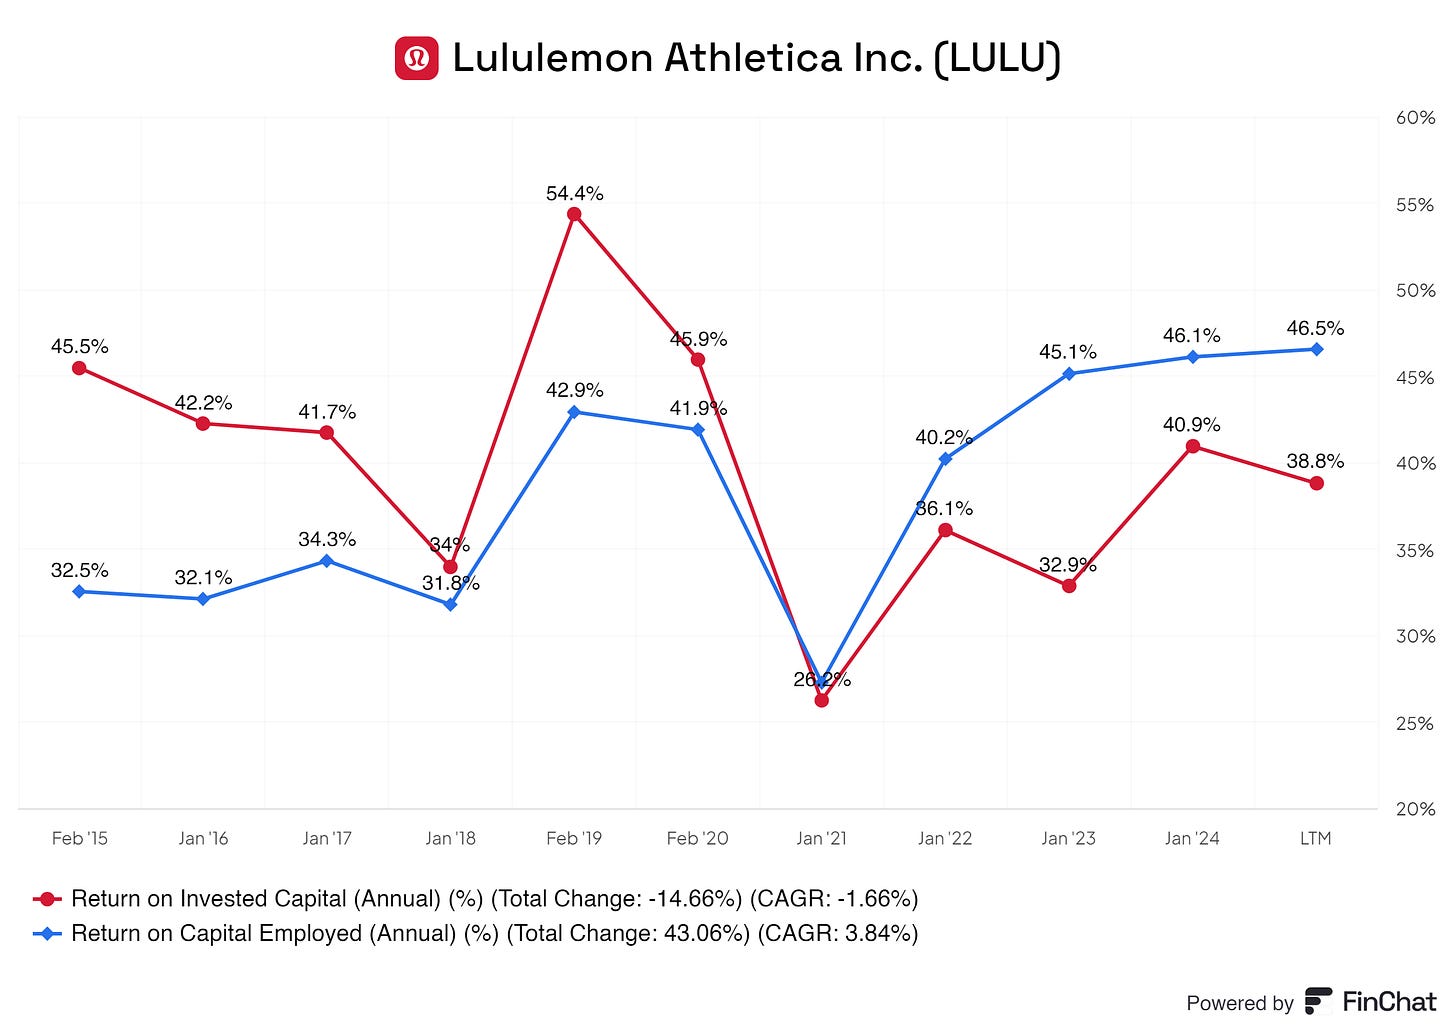
The ROIC, represented by the red line, measures the return the company generates on the capital it has invested in its business. Starting at 45.5% in February 2015, ROIC has experienced some fluctuations over the years. The high point comes in February 2019, when ROIC spikes to 54.4%, indicating that during this period, Lululemon was highly efficient in generating returns from its invested capital. However, there is a notable dip in 2021 when ROIC drops to 26.2%, reflecting a period of lower capital efficiency, possibly due to disruptions such as the COVID-19 pandemic.
On the other hand, the ROCE, shown by the blue line, measures the return that Lululemon generates from its overall capital employed, including both equity and debt. Starting at 32.5% in February 2015, ROCE demonstrates a more consistent upward trend than ROIC. It peaks at 45.1% in January 2023 and remains strong through the LTM, finishing at 46.5%. The total change in ROCE over the period is 43.06%, with a CAGR of 3.84%, suggesting that Lululemon has been improving its ability to generate returns on the capital it employs throughout the period.
Lululemon’s ROCE performance is improving, indicating strong operational management and effective use of its capital. This improvement in capital employed efficiency suggests that Lululemon’s investments and financial strategies are paying off, allowing the company to extract more value from its resources. However, the company should focus on addressing the fluctuations in ROIC and aim to stabilize this metric to ensure that it can consistently generate high returns from its invested capital. Maintaining high ROIC levels while improving ROCE would be ideal for ensuring long-term growth and profitability.
8. Profitability Assessment
8.1 Profitability, Sustainability, and Margins
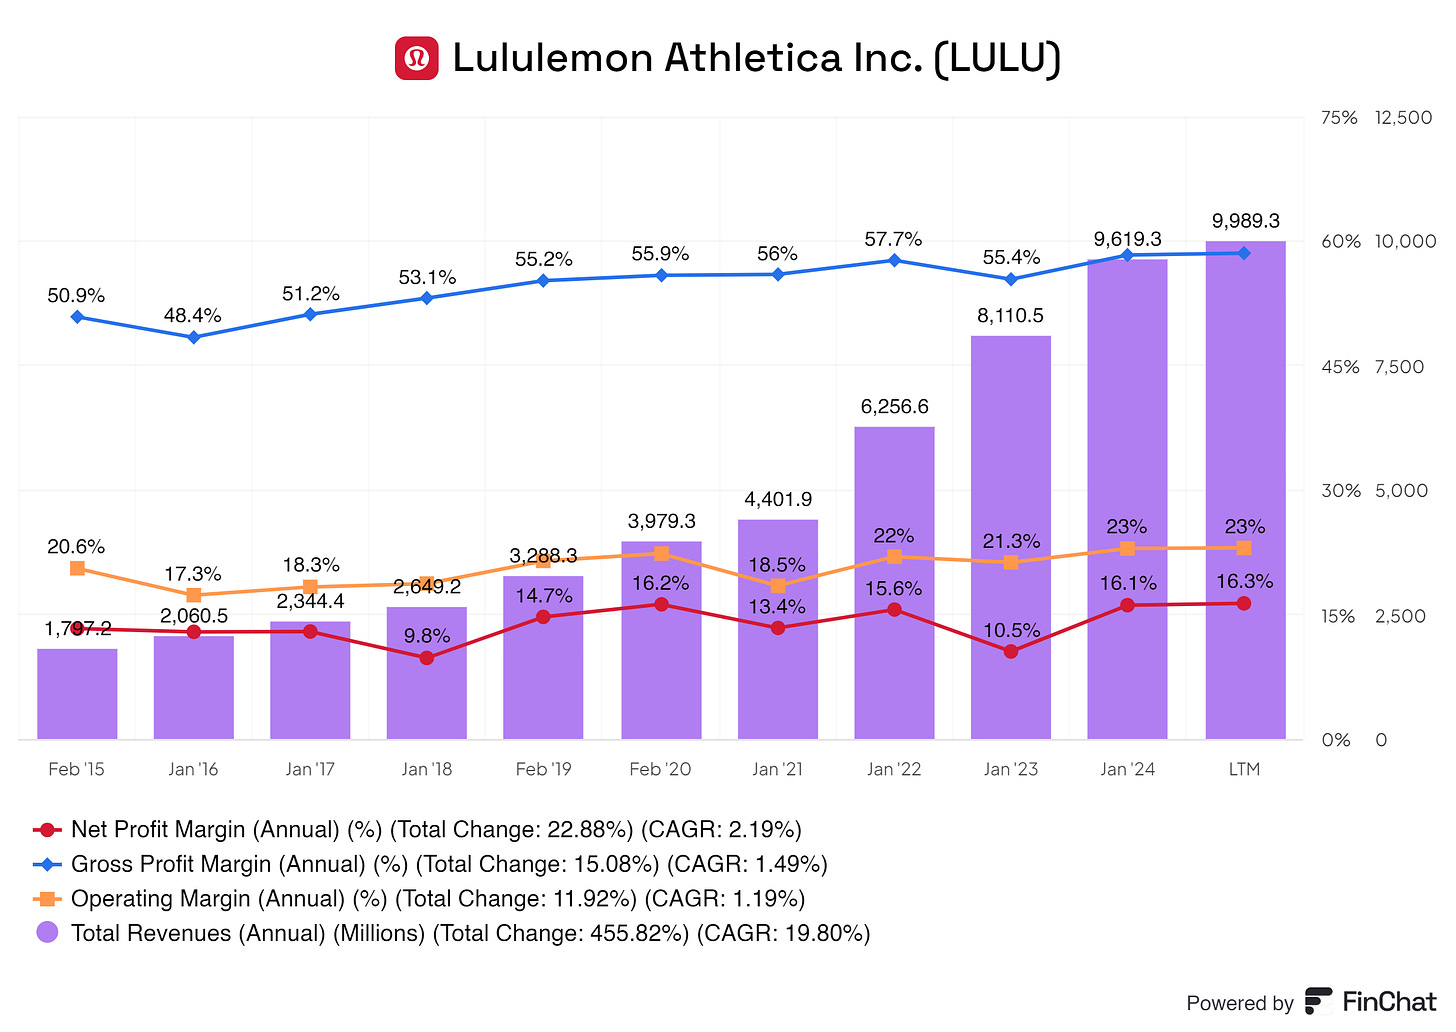
When considering profitability, sustainability, and margins, this chart offers valuable insights into Lululemon's long-term performance and profitability sustainability. Over the years, Lululemon has demonstrated significant revenue growth and maintained robust profitability, which indicates its business model’s strength and the potential sustainability of its performance moving forward.
Profitability:
The key profitability indicators—gross profit margin, operating margin, and net profit margin—paint a strong picture of Lululemon's ability to generate profits.
Gross Profit Margin has steadily improved, from 50.9% in 2015 to 55.4% in LTM. This consistent growth demonstrates that Lululemon has effectively managed its production and operational costs, which is a key driver of its long-term profitability. The ability to sustain and increase gross margins over time shows that the company has pricing power and cost management, which is critical for maintaining profitability as the business scales.
Operating Margin started at 20.6% in 2015 and remains relatively strong at 23% in recent periods. The operating margin reflects how efficiently the company manages its day-to-day operations. Though it fluctuates slightly, the consistency over the years signals that Lululemon has controlled operational expenses relative to its revenue growth. This efficiency is a positive sign of the company's ability to maintain sustainable operations while continuing to grow.
Net Profit Margin has increased from 9.8% in 2017 to 16.3% in LTM, a notable rise that reflects Lululemon’s improved bottom-line profitability. This growth in net margin shows that not only is the company expanding, but it is also becoming more efficient at translating its revenues into actual profits for shareholders. A higher net margin typically indicates that the company is reducing costs, optimizing its operations, or achieving better product pricing, which bodes well for long-term profitability.
Sustainability of Margins:
The sustainability of Lululemon’s margins is supported by its ability to grow revenues consistently while maintaining or improving its margins. The 455.82% increase in revenue over the period, with a CAGR of 19.80%, demonstrates that Lululemon is scaling effectively. Importantly, the fact that margins—particularly the gross profit margin and operating margin—have remained stable or increased during this period suggests that the company is not sacrificing profitability for growth. This balance between revenue growth and margin stability is crucial for the long-term sustainability of the business.
However, it's important to note that maintaining high margins as the company continues to scale will depend on several factors, such as effective cost management, supply chain optimization, and the ability to maintain premium pricing in a competitive market. Lululemon's continued investment in innovation and brand differentiation will be critical to sustaining its pricing power and, by extension, its margins.
What’s Good:
The steady improvement in gross profit margin indicates that Lululemon has reduced costs relative to revenues, showing operational efficiency and pricing power.
A strong and stable operating margin highlights Lululemon’s ability to manage its operating expenses effectively, ensuring the company can maintain profitability as it grows.
The increasing net profit margin shows that Lululemon is growing revenues and improving its ability to convert them into profit, which is key to long-term success.
Things to Monitor:
While margins are currently strong, Lululemon's long-term sustainability will depend on its ability to maintain its brand’s premium positioning and cost structure in the face of rising competition and potential market saturation.
Maintaining high margins could become more challenging as the company expands globally and faces different market conditions, supply chain complexities, and pricing pressures.
8.2 Cash Flow Analysis
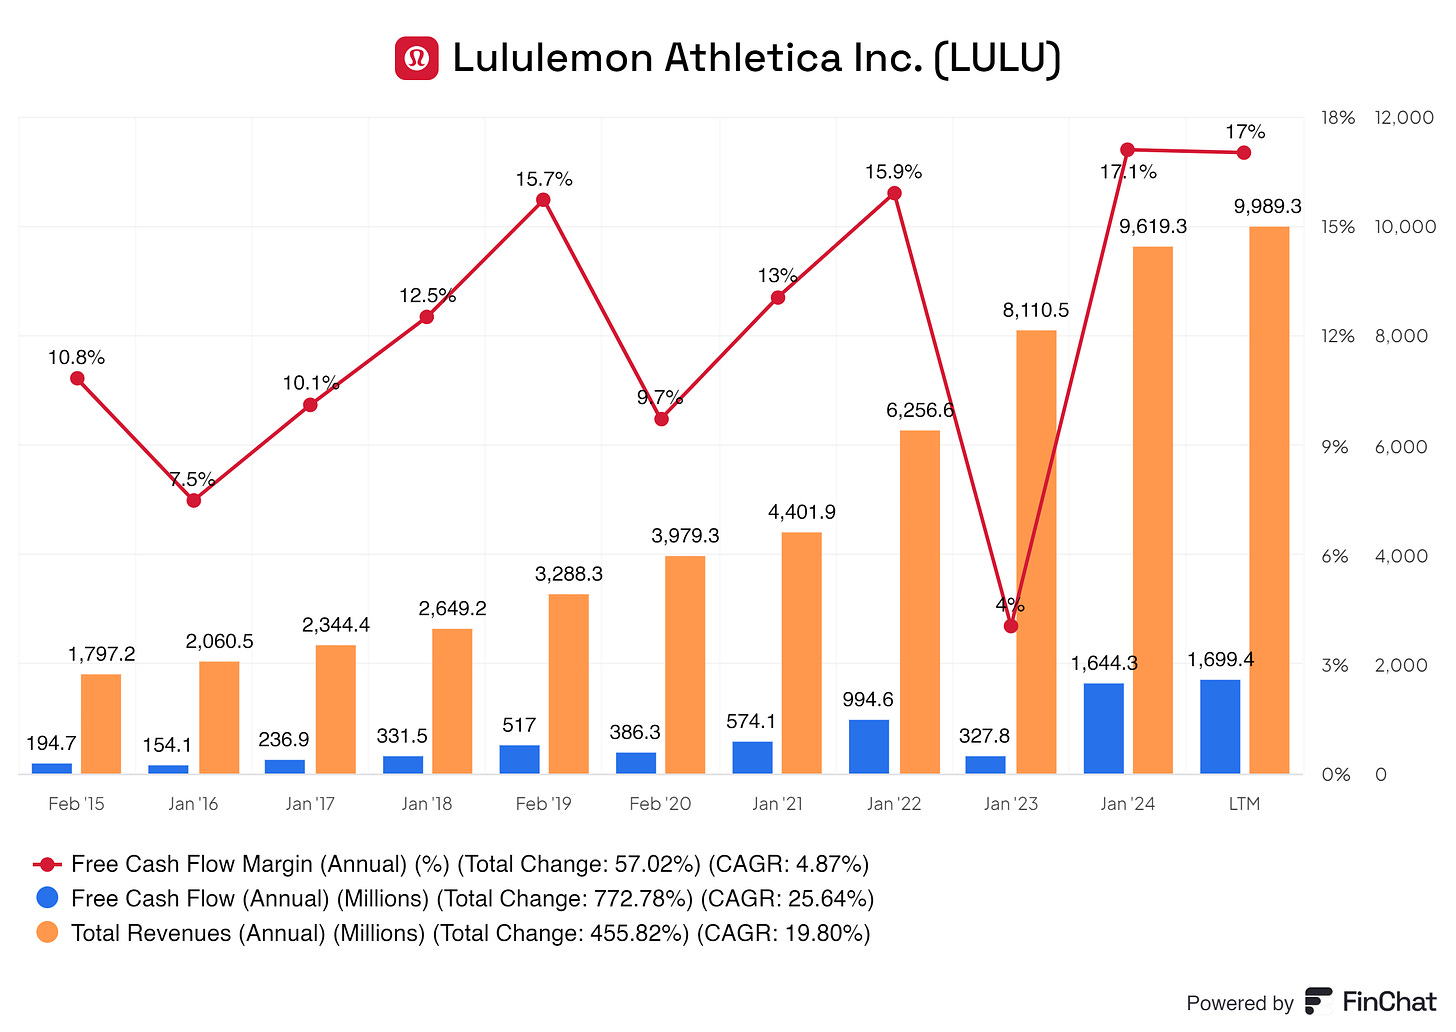
The Free Cash Flow, shown by the blue bars, represents the actual cash Lululemon has available after covering operating expenses and capital expenditures (CAPEX). FCF is a key measure of financial health because it shows how much cash the company generates that can be used for things like paying down debt, investing in growth, or returning money to shareholders.
Lululemon’s FCF has grown substantially, from $194.7 million in 2015 to $1,699.4 million in the LTM, reflecting a total change of 772.78% and a CAGR of 25.64%. This sharp increase in FCF indicates that the company is increasing its revenues and converting a substantial portion of these revenues into cash that it can deploy for strategic initiatives. Notably, a significant dip in FCF in early 2023 dropped to $327.8 million, which could indicate a one-off expense, investment, or temporary disruption. However, the FCF recovered quickly, returning to $1,699.4 million in LTM, suggesting that this dip did not indicate a longer-term issue.
The Free Cash Flow Margin, represented by the red line, measures the percentage of revenue converted into free cash flow. A higher margin indicates that the company generates a strong amount of cash relative to its sales.
Lululemon’s FCF margin has been somewhat volatile, beginning at 10.8% in February 2015, peaking at 15.9% in early 2022, before dipping to 4% in early 2023 and rising again to 17% in LTM. Over the period, this reflects a total change of 57.02% with a CAGR of 4.87%. This fluctuation suggests that while Lululemon can generate free cash flow, there are periods when cash flow tightens, likely due to capital investments, temporary operational inefficiencies, or broader market conditions. However, the recovery to 17% in the most recent period is an excellent signal of strong cash generation capabilities, positioning Lululemon well for future growth and investment.
Lululemon’s financial metrics regarding cash flow and revenues signal a strong and sustainable business model. With revenues growing at an impressive rate and free cash flow rising significantly, the company is well-positioned to reinvest in its business, reward shareholders, and sustain growth. The volatility in free cash flow margins should be monitored, but overall, the trend is highly positive, reflecting a company that is increasingly adept at converting its revenues into cash. This strong cash position is essential for ensuring long-term sustainability, particularly in the competitive retail landscape.
9. Growth Analysis
9.1 Historical Growth Trends
Lululemon has been a steady grower since 2015. There have been no sudden spikes or absurd growth in the business, making the historical growth more sustainable in the future.
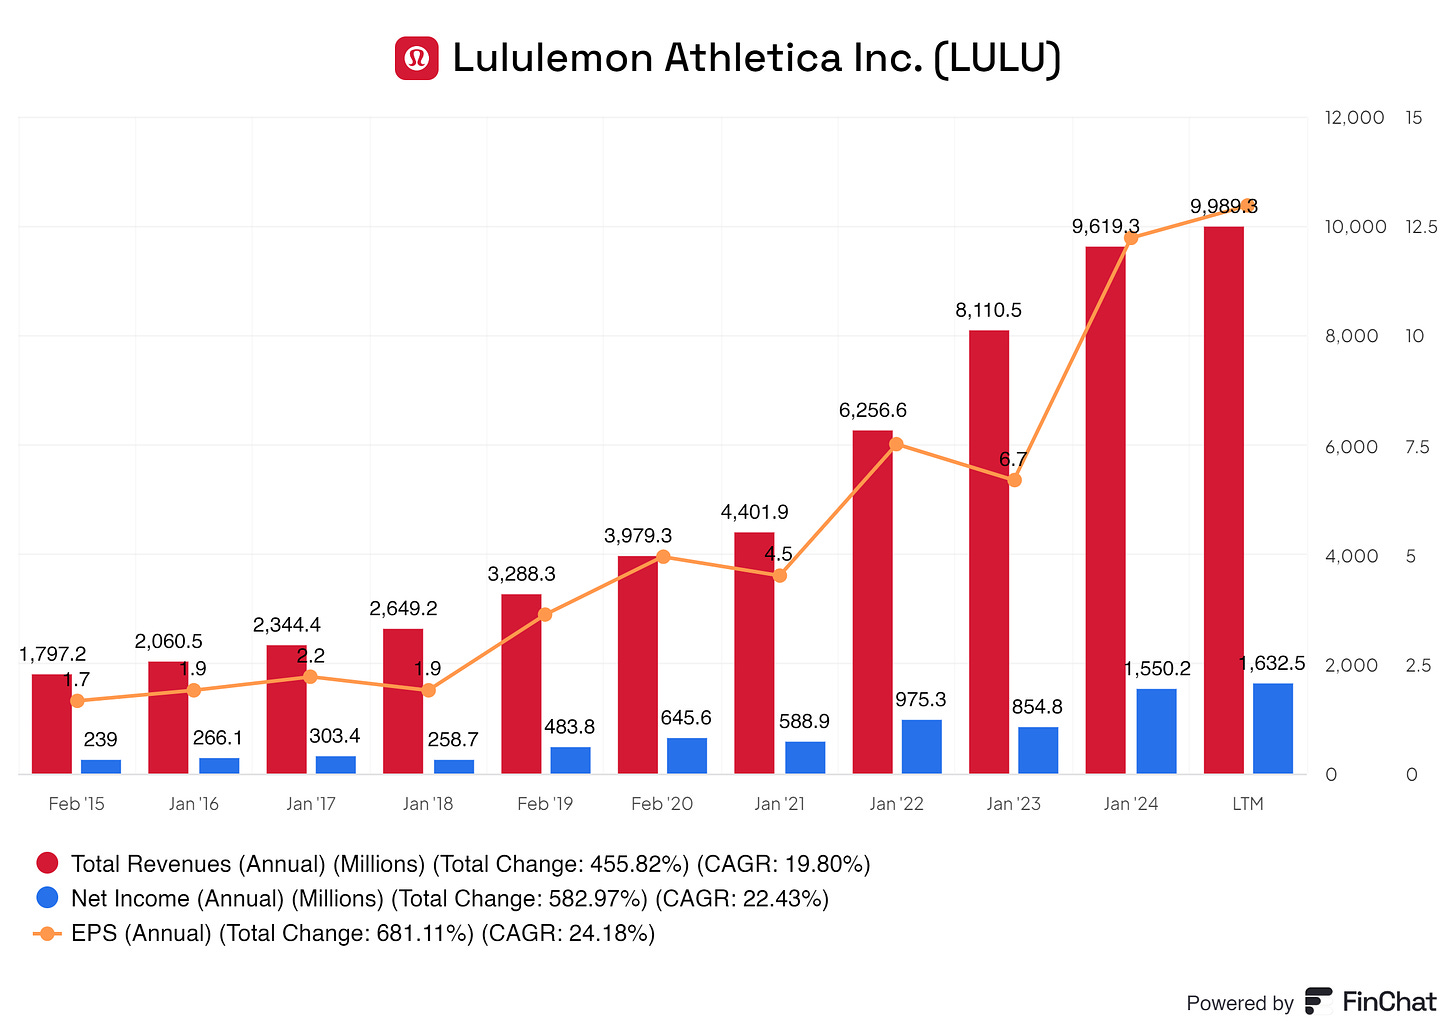
Lululemon has been growing its total revenue with a CAGR of 19.80%, which is surprisingly good. In that same period, Nike's CAGR was 5.45%. Of course, we could discuss that Nike is a more mature business, but looking at other competitors, this kind of growth from Lululemon is exceptional. Nike’s EPS CAGR was 6.86%, and the net income CAGR was 5.35% in that same period, while Lululemon is in the low 20% digits; even younger businesses in the activewear are not doing CAGR Nike is doing in that same period.
Yes, there will be a slowdown, as less growth is expected for the active apparel sector. Nike even announced that its total revenue will shrink in 2025/2026.
Even with all this, the historical growth has been amazing. The slowdown is expected and priced in, but still, Lululemon is performing exceptionally. This can be sustained for the future once consumer spending increases again and the market starts shifting into the right gear again.
9.2 Future Growth Projections
The future does not look too good for the active apparel sector.
Due to unfavorable economic environments in the coming years, there will be less spending. Lululemon is expected to grow roughly 8% to 9% per year for the next five years. Of course, once the market settles again and consumers feel more inclined to spend, the market will pick up pace again. But the future does not look too bright for active wear businesses.
10. Value Proposition
10.1 Dividends Analysis
Lululemon does not pay a dividend, which is good. Lululemon is growing and should, as it is doing, reinvest all possible capital into the business to promote growth.
Lululemon said:
We do not anticipate paying any cash dividends on our common stock in the foreseeable future - Annual Report 2023
10.2 Share Repurchase Programs
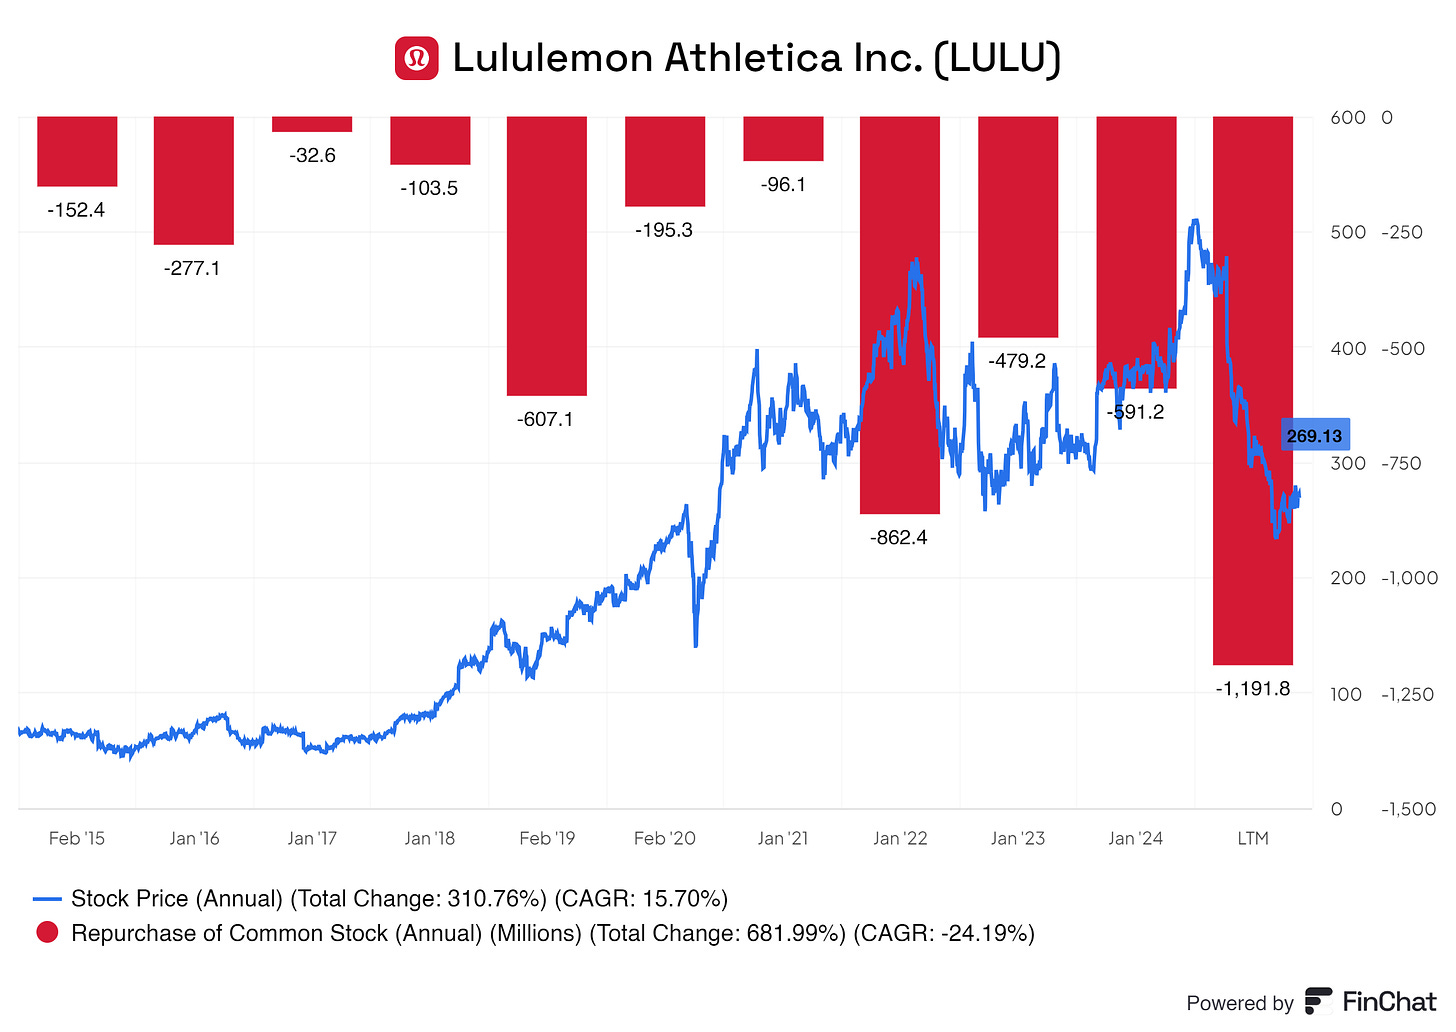
On March 23, 2022 and November 29, 2023, the Company's board of directors approved stock repurchase programs, each for up to $1.0 billion of the Company's common shares on the open market or in privately negotiated transactions. - Annual Report 2023
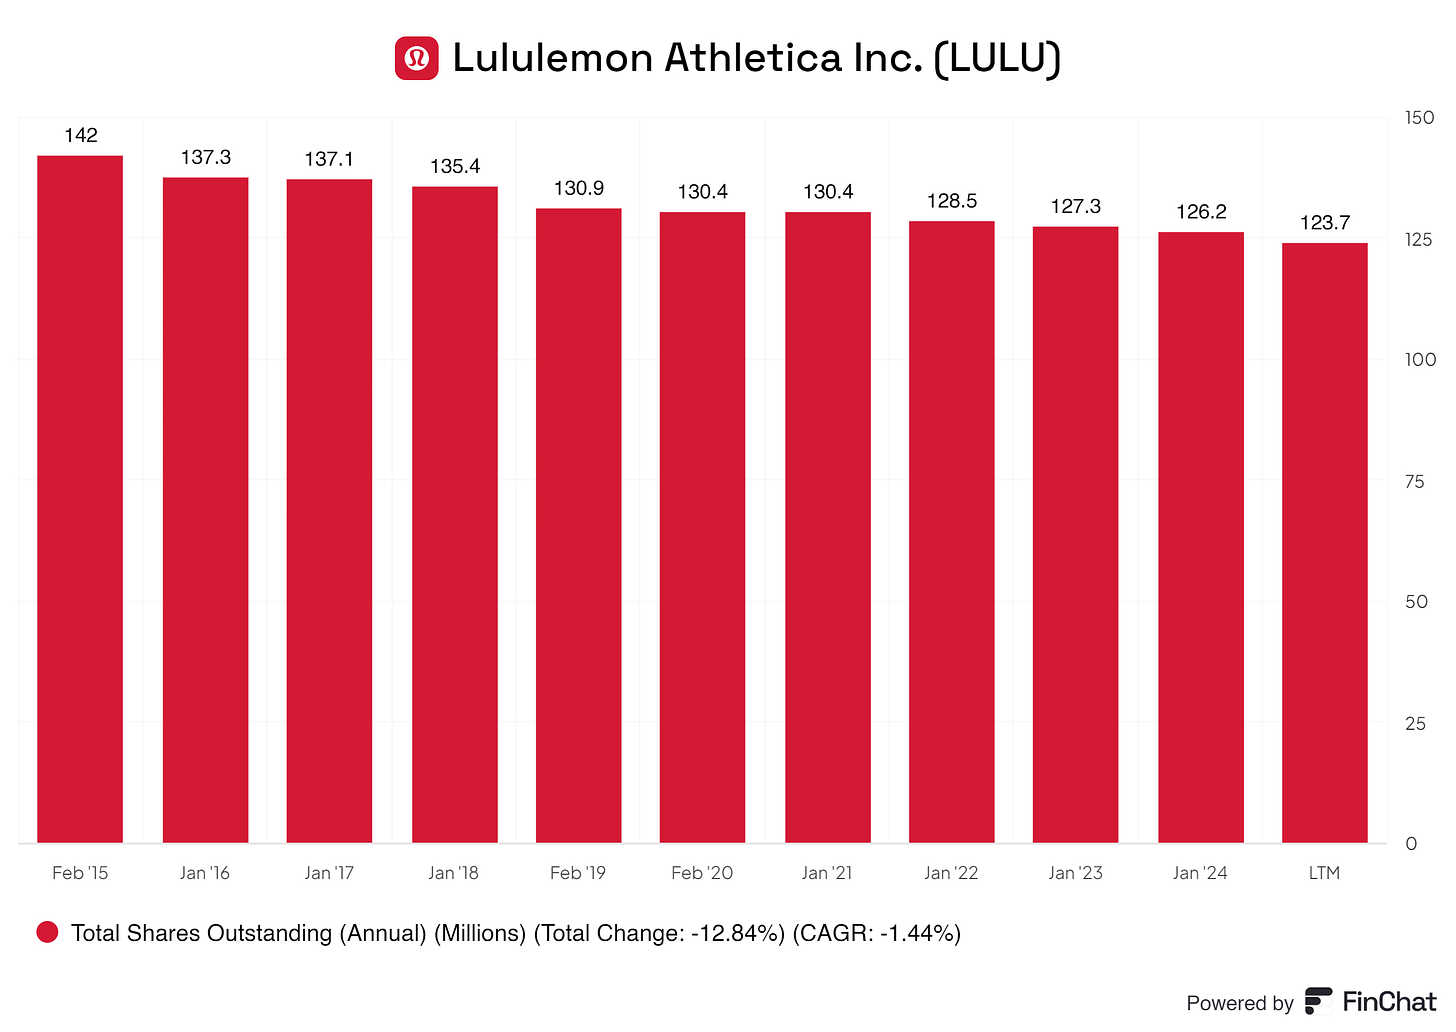
Lululemon has been buying back shares yearly, creating more value per share for every shareholder.
In addition, Lululemon has been buying back shares when the stock price dropped. This indicates that management is not ‘‘just buying back shares’’ but buying them at more favorable prices. This should tell investors that Lululemon deploys its capital correctly and doesn’t just randomly buy back shares to make its shareholders happy; this is quality from management.
10.3 Debt Reduction Strategy
There’s some debt reduction, but debt is not a worry for Lululemon. :-)
11. Future Outlook
Lululemon has positioned itself as a dominant player in the activewear and athleisure markets, and its future outlook remains promising despite an increasingly challenging environment. Expect Lululemon to grow at an 8% annual rate, reflecting optimism and caution in a market characterized by shifting consumer preferences, heightened competition, and evolving economic conditions.
The projected 8% growth aligns with Lululemon's historical performance but comes in a challenging macroeconomic environment. Rising inflation, fluctuating consumer spending, increasing competition from legacy players like Nike and Adidas and newer entrants in the premium activewear space mean that Lululemon must stay agile and innovative. However, the company’s consistent revenue and margin growth over the years indicate that it is well-positioned to navigate these headwinds. Its ability to continuously innovate and offer new products while maintaining strong brand equity will drive this growth.
Lululemon’s strong balance sheet is critical in its ability to weather economic downturns and continue investing in growth. With growing free cash flow and consistent profitability, the company has the financial flexibility to reinvest in its operations, open new stores, and expand into new international markets. This financial strength also allows Lululemon to fund innovation, which is crucial as consumer preferences in the activewear industry evolve. Additionally, its balance sheet provides a safety net against external economic challenges, ensuring the company can continue operating without relying on excessive debt or external financing.
Lululemon’s ability to maintain and grow its loyal customer base is one of its greatest strengths. The company’s core following, often described as having a "cult-like" devotion, ensures a steady stream of repeat customers. This brand loyalty is particularly important as the company expands globally, allowing it to introduce new product lines, including men's apparel and accessories while relying on its established reputation for quality and performance. The strong community and customer engagement, through initiatives like in-store fitness events and a focus on wellness, further entrench Lululemon’s brand as a lifestyle choice rather than just a retailer.
Looking forward, the future of the active apparel market is promising as consumers increasingly prioritize health, wellness, and an active lifestyle. The demand for high-quality, versatile apparel that can transition from exercise to everyday wear is expected to grow, and Lululemon is well-positioned to capitalize on this trend. Innovations in fabric technology, sustainability, and performance wear will be critical areas of focus for Lululemon to stay ahead of competitors. Moreover, as consumers seek more sustainable options, Lululemon’s investment in environmentally friendly materials and responsible production processes will likely resonate with its customer base, particularly younger generations.
Lululemon has also begun to expand its offerings beyond traditional apparel, with forays into fitness technology (such as the Mirror acquisition), which could be a growth driver in the future. As the lines between fitness, technology, and lifestyle continue to blur, Lululemon’s ability to position itself at the intersection of these trends could create new revenue streams and further differentiate it from competitors.
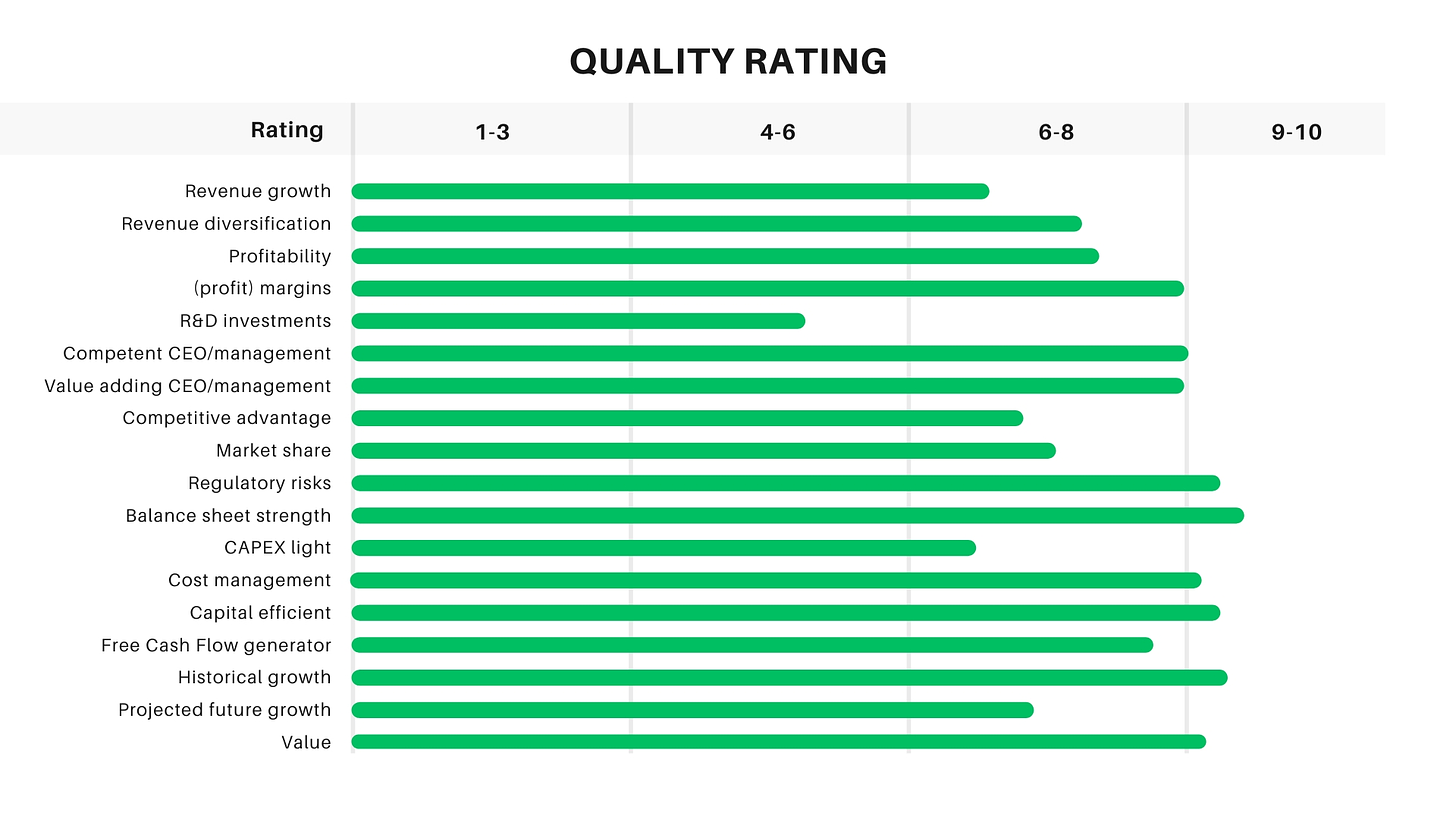
12. Quality Rating
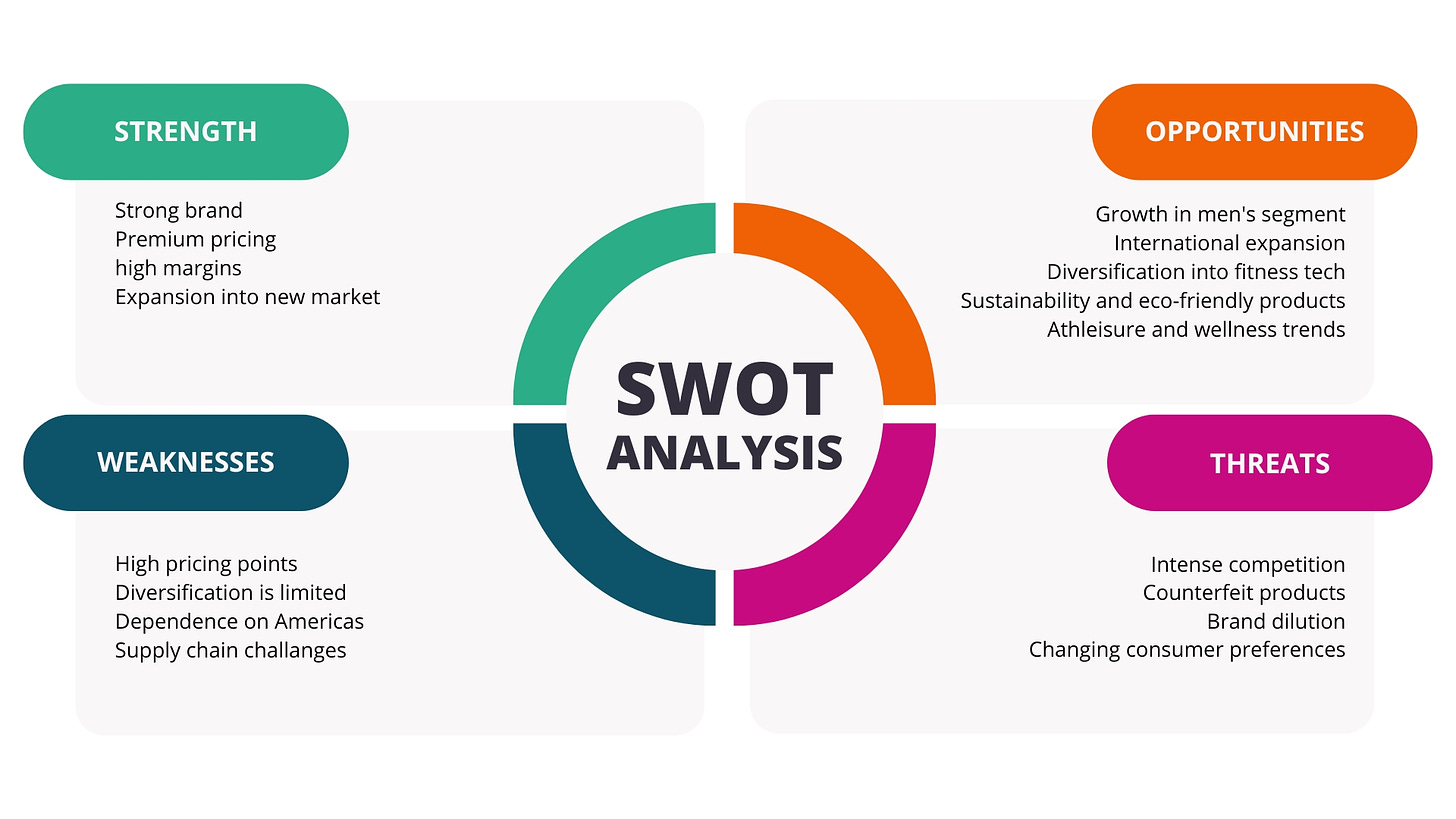
13. SWOT Analysis
14. Valuation Assessment
Let us crunch some numbers!
DCF: $379,76
Multiple Valuation: $259,52
Benjamin Graham’s Valuation: $264,17
Analysts Average: $317,38
Average of: $305,14
Current Price: $270,43
Lululemon is undervalued if we look at the average of these four methods!
End note
Thank you for reading this investment case on Lululemon!
With every investment case, I am trying to improve my writing and how I communicate my findings with you all. Because I started not too long ago, some posts might change in layout or other aspects before I find the design that suits my best wishes; sorry in advance.
As of now, thank you so much for your time! I hope you found some valuable information in this investment case.
Disclaimer
I own Lululemon shares, which account for roughly 7% of my portfolio. I might buy more Lululemon shares in the next six months.
By reading my posts, being subscribed, following me, and visiting my Substack, you agree to my disclaimer. You can read the disclaimer here.




Interesting to read about Lulu. I have my students play a stock-picking game and Lulu is one of their choices. Go back a year, and it has been a big loss-maker for owners. Can you imagine if you bought then, rather than NVDA? I appreciate your work and will follow. But, looking forward, diversification is key because company-specific risk is not rewarded in the market.