Hey there, partner! 👋
Before we dive in, I need your support to keep these articles FREE.
If you're enjoying this content, here's how you can help:
Like the article
Please share it on your social media
Comment below to join the conversation
Your engagement means everything. Thanks for being part of the journey! Now, let's get started.
Welcome to another edition of ‘‘Best Buys’’. In these articles, I lay out what I think now is the best business to buy at a fair price.
In today’s article, we’ll cover the business that runs the payment industry together with Mastercard and Visa.
In the global financial services landscape, Visa Inc. stands out as a foundational investment offering stability and substantial growth potential. As the world accelerates towards a digital-first economy, the shift from cash to electronic payments continues to expand, positioning Visa at the forefront of this transformative trend. With its unparalleled network, brand strength, and commitment to innovation, Visa maintains a competitive edge and is poised to capitalize on emerging opportunities across the payments ecosystem. This article explores why Visa represents a compelling addition to any investment portfolio, anchored by its resilient business model, growth prospects, and the expansive potential of the global payments market.
Quick Business Overview
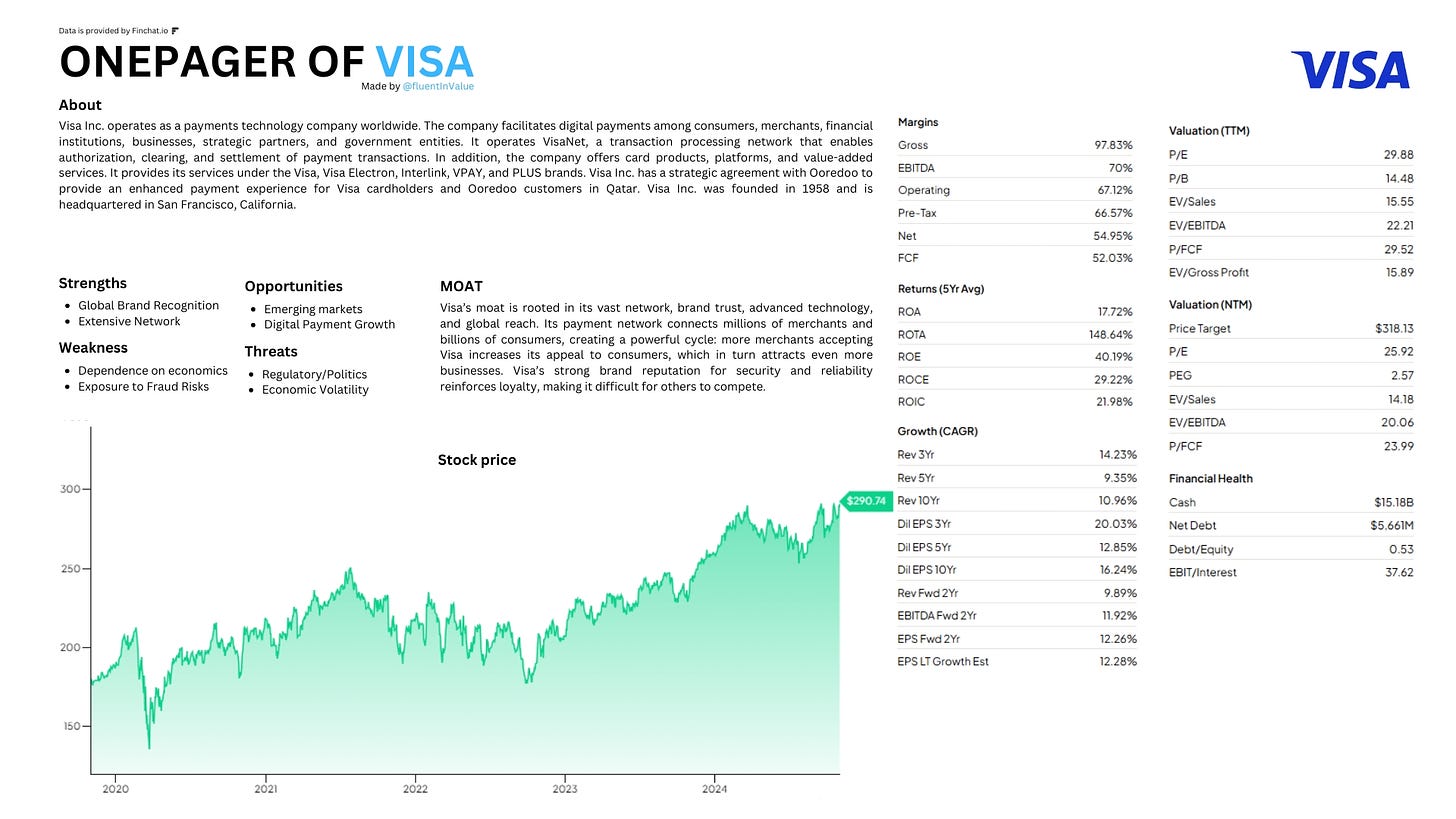
Visa Inc. operates as a payments technology company worldwide. The company facilitates digital payments among consumers, merchants, financial institutions, businesses, strategic partners, and government entities. It operates VisaNet, a transaction processing network that enables authorization, clearing, and settlement of payment transactions. In addition, the company offers card products, platforms, and value-added services. It provides services under the Visa, Visa Electron, Interlink, VPAY, and PLUS brands. Visa Inc. has a strategic agreement with Ooredoo to give an enhanced payment experience for Visa cardholders and Ooredoo customers in Qatar. Visa Inc. was founded in 1958 and is headquartered in San Francisco, California.
Visa One-pager
My Thesis on Visa
Visa’s business model is a masterclass in leveraging network effects and scale. Visa operates the world’s largest electronic payment network at its core, facilitating transactions between consumers, merchants, and financial institutions across more than 200 countries. This expansive network creates a self-reinforcing cycle that continuously strengthens its market position: as more merchants accept Visa, the network becomes increasingly valuable to consumers, which drives even greater merchant adoption. This virtuous cycle establishes formidable barriers to entry for competitors and fosters a durable competitive moat, ensuring long-term relevance and market leadership.
From Cash to Card
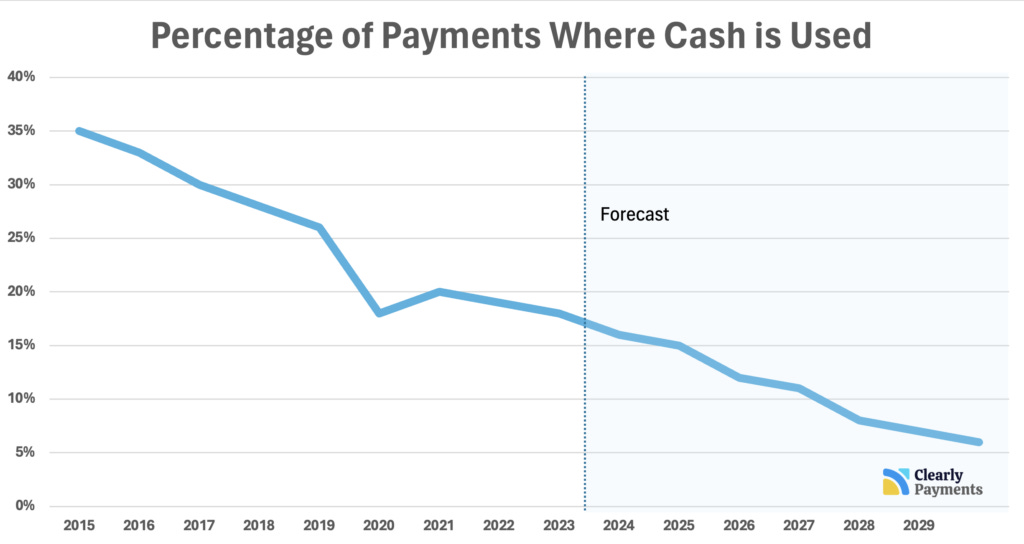
Several key drivers underpin Visa's growth potential. First and foremost is the global shift towards a cashless society, a trend significantly accelerated by the digital transformation of economies worldwide. Despite the substantial progress made in digital payments, many international transactions, particularly in emerging markets, are still conducted in cash. This presents Visa with a vast runway for growth as these regions increasingly adopt electronic payments.
According to studies conducted by the Federal Reserve, cash usage has been on a steady decline. In 2021, cash was used for approximately 20% of all transactions. Fast forward to 2024, and the downward trend persists, with reports indicating that cash payments now represent a mere 16% of all transactions. This significant drop underscores a fundamental shift in consumer preferences towards digital alternatives.
The Young Generation is Taking Over With Cards and Digital Payments
The data shows that payments are moving rapidly towards digital solutions, with younger generations setting the pace. However, cash is still widely used in specific demographics and situations. Looking forward, it's likely that traditional and digital payment methods will continue to coexist, providing flexibility for the varied needs and preferences of a global population. Below are key trends and stats on payment preferences, broken down by age, income, and location.
Payment Trends by Age Group:
Gen Z & Millennials (1981-2012): Gen Z and Millennials are at the forefront of contactless payment adoption. A study from PYMNTS.com found that 54% of Gen Z shoppers prefer contactless methods, while only 22% opt for cash. Mobile wallets are also hugely popular among these groups; Juniper Research projects that by 2024, there will be 4.6 billion mobile wallet users globally, with this generation leading the way. They’re strategic with credit cards too, with 77% using them for budgeting and rewards, according to a PayPal study, while also being mindful of avoiding debt.
Gen X (1965-1980): Gen X is somewhat of a middle ground in payment preferences. Data from the Federal Reserve’s Diary of Consumer Payment Choice indicates that Gen Xers use debit cards for 32% of their transactions, more than Millennials’ 22%. They also use credit cards for about 26% of transactions, though they’re likely more cautious, having witnessed older generations struggle with debt.
Baby Boomers (1946-1964): Baby Boomers still favor cash more than other groups. A Federal Reserve Bank of Boston study shows they use cash in 40% of transactions, above the national average of 29%. They may feel that cash helps them manage spending more effectively. Debit cards make up 29% of their transactions, while credit card usage, at 22%, is lower compared to younger generations.
Payment Trends by Income Level:
Higher Income ($75,000+): Higher-income individuals use various payment methods. A study by Mercator Advisory Group shows they favor credit cards (38% of transactions) for rewards and credit building, debit cards (29%) for daily purchases, and digital wallets (20%) for convenience. Cash usage is relatively low, around 13%.
Lower Income (Under $35,000): In lower-income brackets, cash dominates (52% of transactions), often due to limited access to credit or banking services. Debit cards are used for 28% of transactions to manage spending, while credit card use is limited (10%), likely to avoid debt.
Payment Trends by Location:
Urban vs. Rural: Payment preferences vary by location. A Visa study reported that 78% of urban consumers used contactless payments in 2023, compared to 59% in rural areas. This gap may stem from easier access to tech infrastructure and more contactless-friendly merchants in urban areas.
Cash Preference in Developing Countries: In many developing countries, access to banks and financial services is limited, making cash the primary payment method. Due to infrastructure challenges, credit and debit card access is also lower.
Credit Card Use in Developed Countries: Developed economies like the U.S. and Canada have robust banking systems and high credit card penetration. Digital technology adoption is also high, making cashless payments popular for speed, convenience, and security.
Europe: While credit cards are widely used, countries like Germany and Austria still rely more heavily on cash, possibly due to cultural preferences or privacy concerns about digital payments.
Asia: Digital wallets, like Alipay and WeChat Pay, are experiencing significant growth in China, reducing cash usage. However, cash remains essential in parts of Southeast Asia.
These trends underscore how payment choices vary based on age, income, and location, shaping a diverse payment landscape.
E-commerce
Global retail e-commerce sales have seen impressive growth, reaching $4.4 trillion in 2023, up from $1.3 trillion in 2014. This growth means online shopping accounts for 20% of all global retail sales. By 2028, Forrester projects that global e-commerce sales will reach $6.8 trillion, representing 24% of retail sales. However, brick-and-mortar stores will still play a significant role, with $21.9 trillion of the projected $28.7 trillion in global retail sales occurring offline in 2028.
The pandemic initially accelerated e-commerce growth as store closures and social distancing shifted more shopping online. However, as consumers returned to physical stores in recent years, e-commerce growth has slowed. Looking forward to 2024 and beyond, online sales are expected to regain momentum, spurred by shopping deals and innovations like generative AI. Key drivers of global e-commerce growth include:
Diverse and Expanding Channels: The surge in online retail activity is due to online marketplaces, social commerce, online grocery services, click-and-collect options, quick commerce, livestream shopping, and direct-to-consumer sales.
Increasing E-commerce Maturity Among Shoppers: In digitally advanced economies like South Korea, the UK, and the US, high internet access and digital literacy have fueled e-commerce growth. Emerging markets are quickly catching up, powered by rising smartphone use, mobile shopping options, and younger demographics. Marketplaces such as Allegro, Flipkart, Lazada, Mercado Libre, and Shopee are broadening access across these regions.
Innovative Payment Solutions: Digital wallets and account-to-account (A2A) transfers transform global e-commerce by offering secure, seamless, cashless transactions. Digital wallets make purchasing fast and convenient, often including loyalty features, while A2A transfers provide direct, low-cost bank transactions that are both quick and secure.
The recently published Global Retail E-Commerce Forecast, 2024 to 2028, includes data from 2014 and forecasts retail trends—both online and offline—for the next five years in 40 countries, representing 88% of global GDP. The results are presented in local currencies and US dollars.
Excellent Balance Sheet and Margins
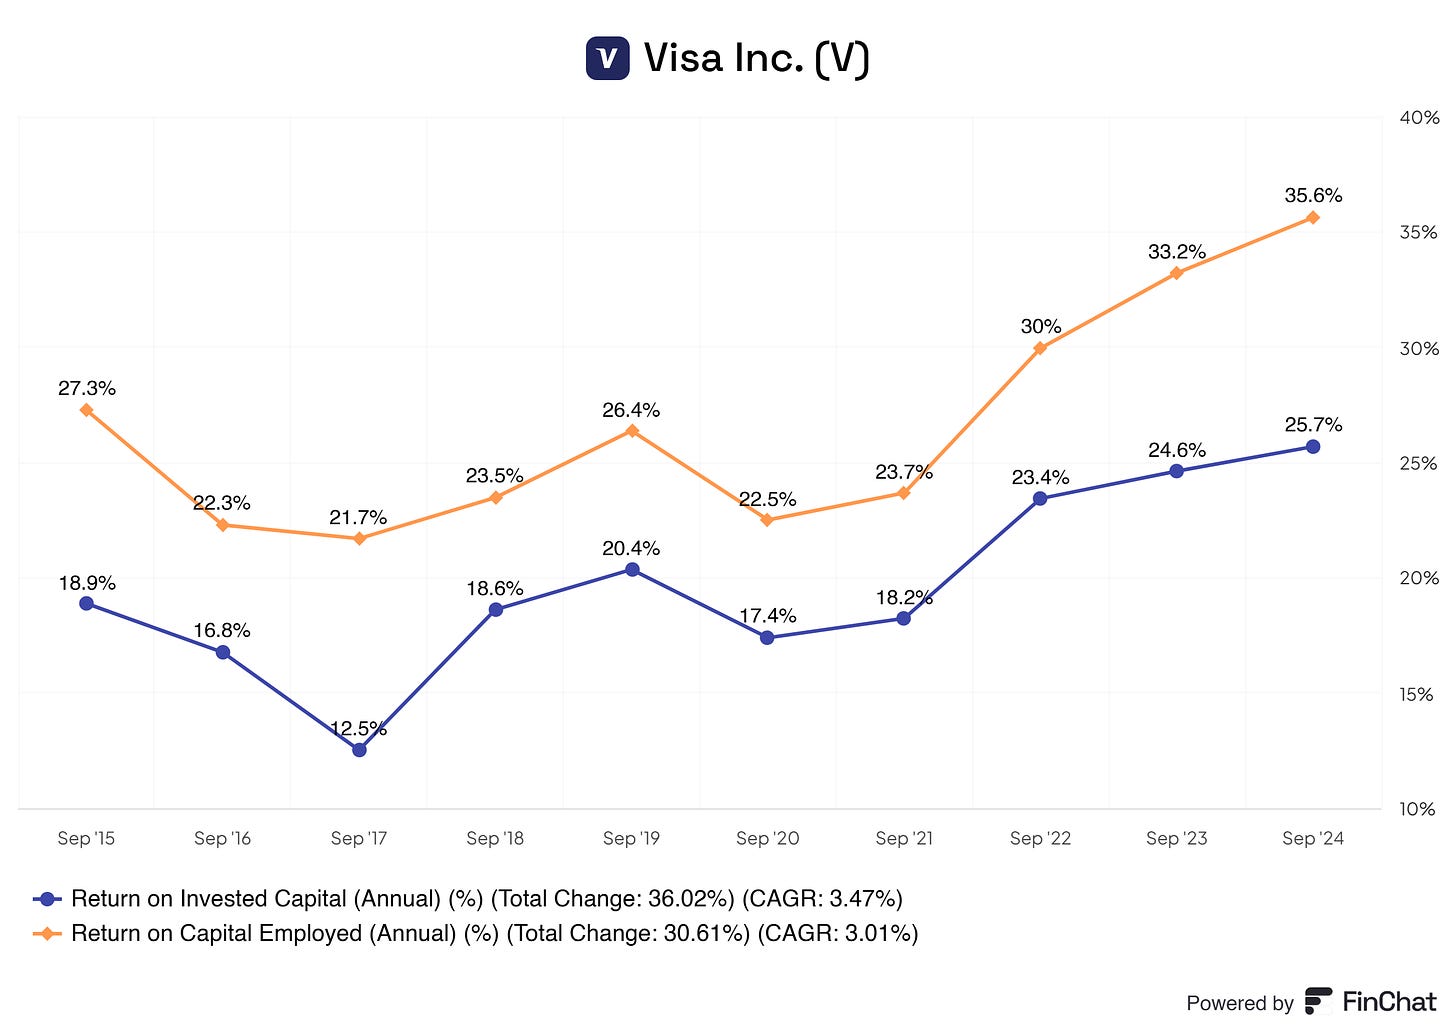
Starting with Visa's return metrics, the Return on Invested Capital (ROIC) and Return on Capital Employed (ROCE) show a steady upward trajectory. Over time, ROIC has grown by 36.02% with a compound annual growth rate (CAGR) of 3.47%, while ROCE has increased by 30.61%, achieving a CAGR of 3.01%. These rising figures underscore Visa’s effective use of capital, highlighting its ability to generate substantial investment returns. With ROIC reaching 25.7% and ROCE climbing to an impressive 35.6%, Visa demonstrates excellent financial discipline and a strong capacity for value creation. This kind of capital efficiency is rare and suggests Visa’s commitment to maximizing shareholder value.
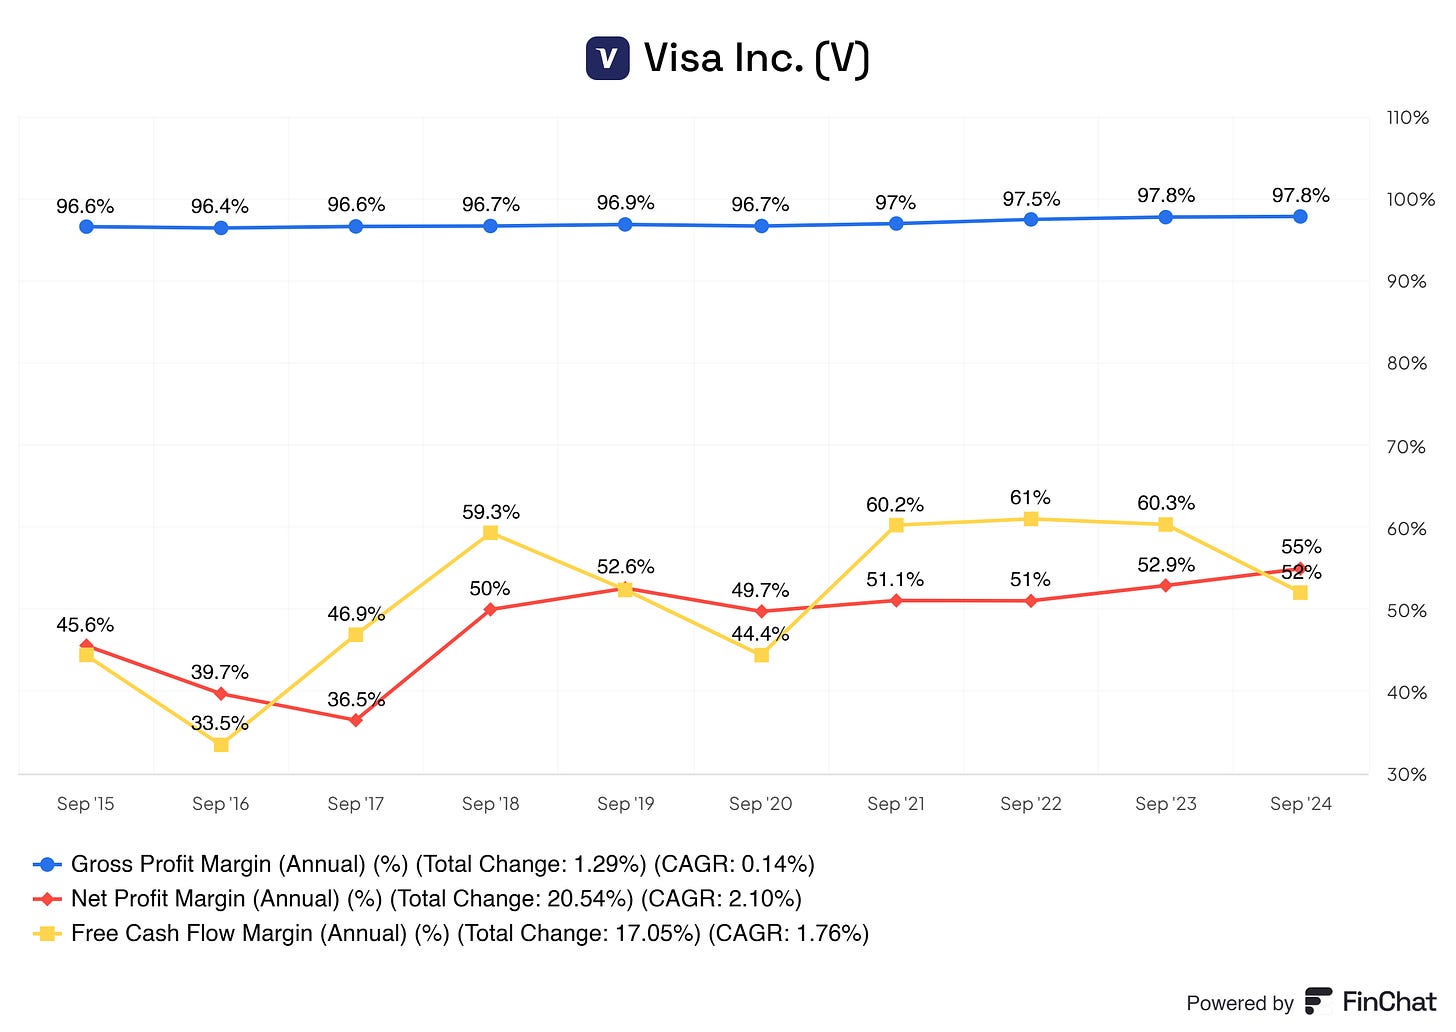
Visa’s profit margins also reveal its strength in sustaining high profitability. Its gross profit margin has remained exceptionally high, consistently around 97%, which reflects a solid cost structure and operational efficiency. Such stability in the gross margin indicates that Visa has a resilient business model capable of weathering fluctuations in costs while maintaining its profitability. Net profit margin has also shown substantial growth, with a total change of 20.54% and a CAGR of 2.10%, reflecting Visa’s ability to convert revenue into profit effectively. Furthermore, the free cash flow margin, which grew by 17.05% at a CAGR of 1.76%, highlights Visa’s ability to generate substantial cash flows, allowing it to invest in growth opportunities, return capital to shareholders, or further strengthen its financial position.
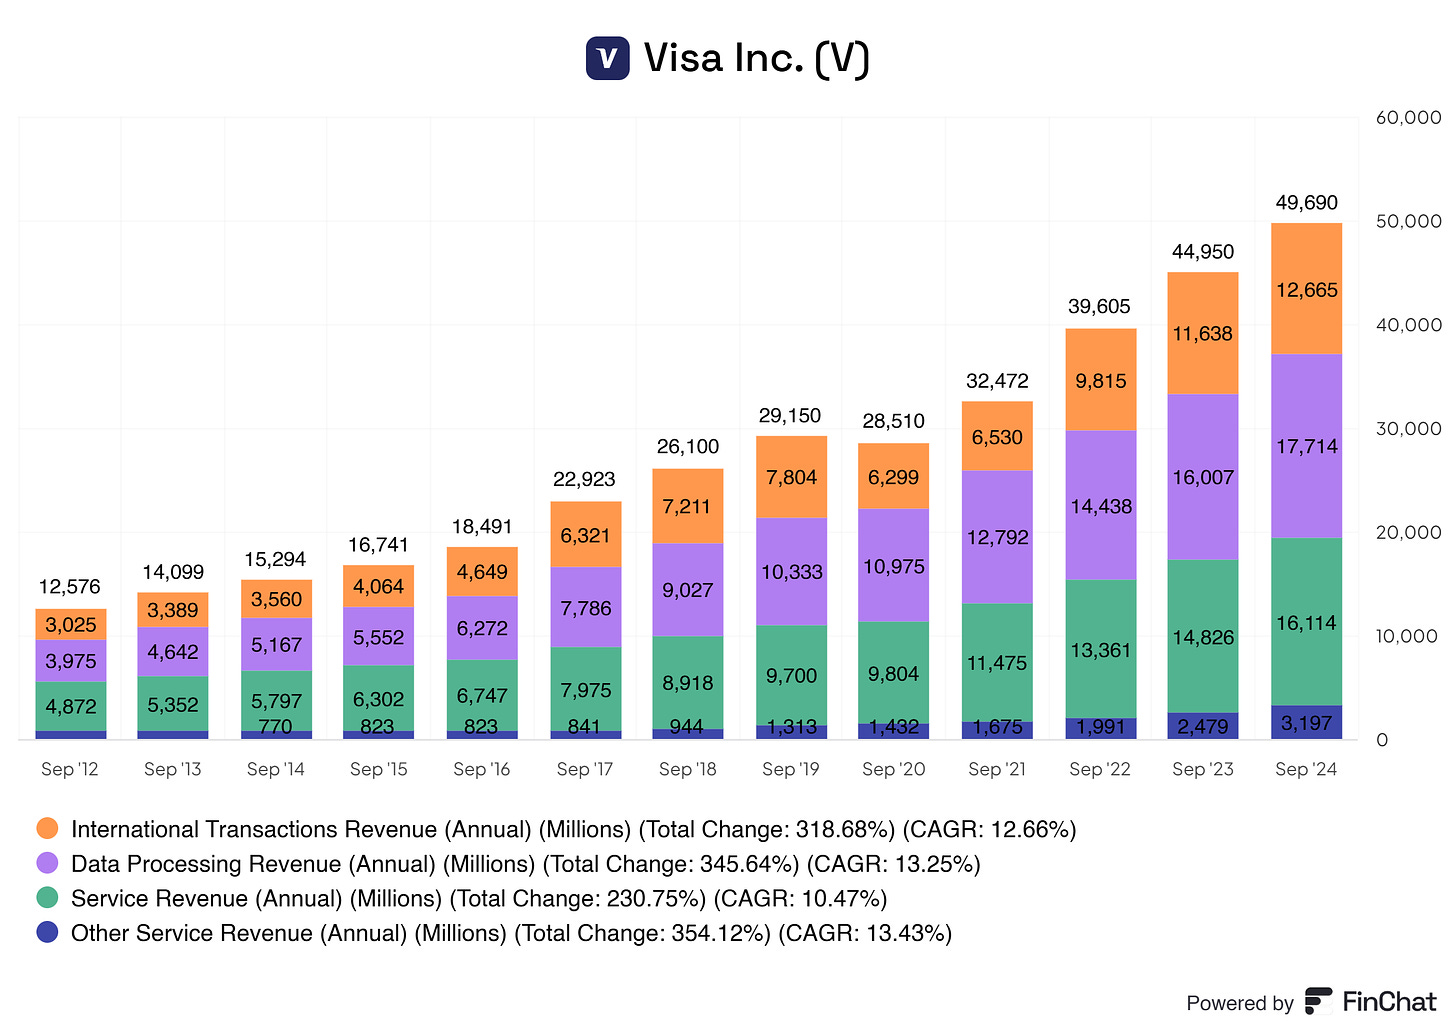
Revenue growth is another highlight for Visa. The breakdown of revenue sources shows impressive gains across all segments. International transactions, data processing, and service revenue have grown by over 200% since 2012, with CAGRs of 12.66%, 13.25%, and 10.47%, respectively. These consistent increases demonstrate Visa’s ability to capture a larger share of the global payments market, benefiting from the growing shift to cashless transactions. Additionally, the “Other Service Revenue” segment grew by an outstanding 354.12%, with a CAGR of 13.43%, indicating Visa’s success in diversifying its revenue streams. Visa’s strong growth across these revenue streams underscores its position as a leading player in the payments industry and highlights its ability to adapt to emerging trends and capture new opportunities.
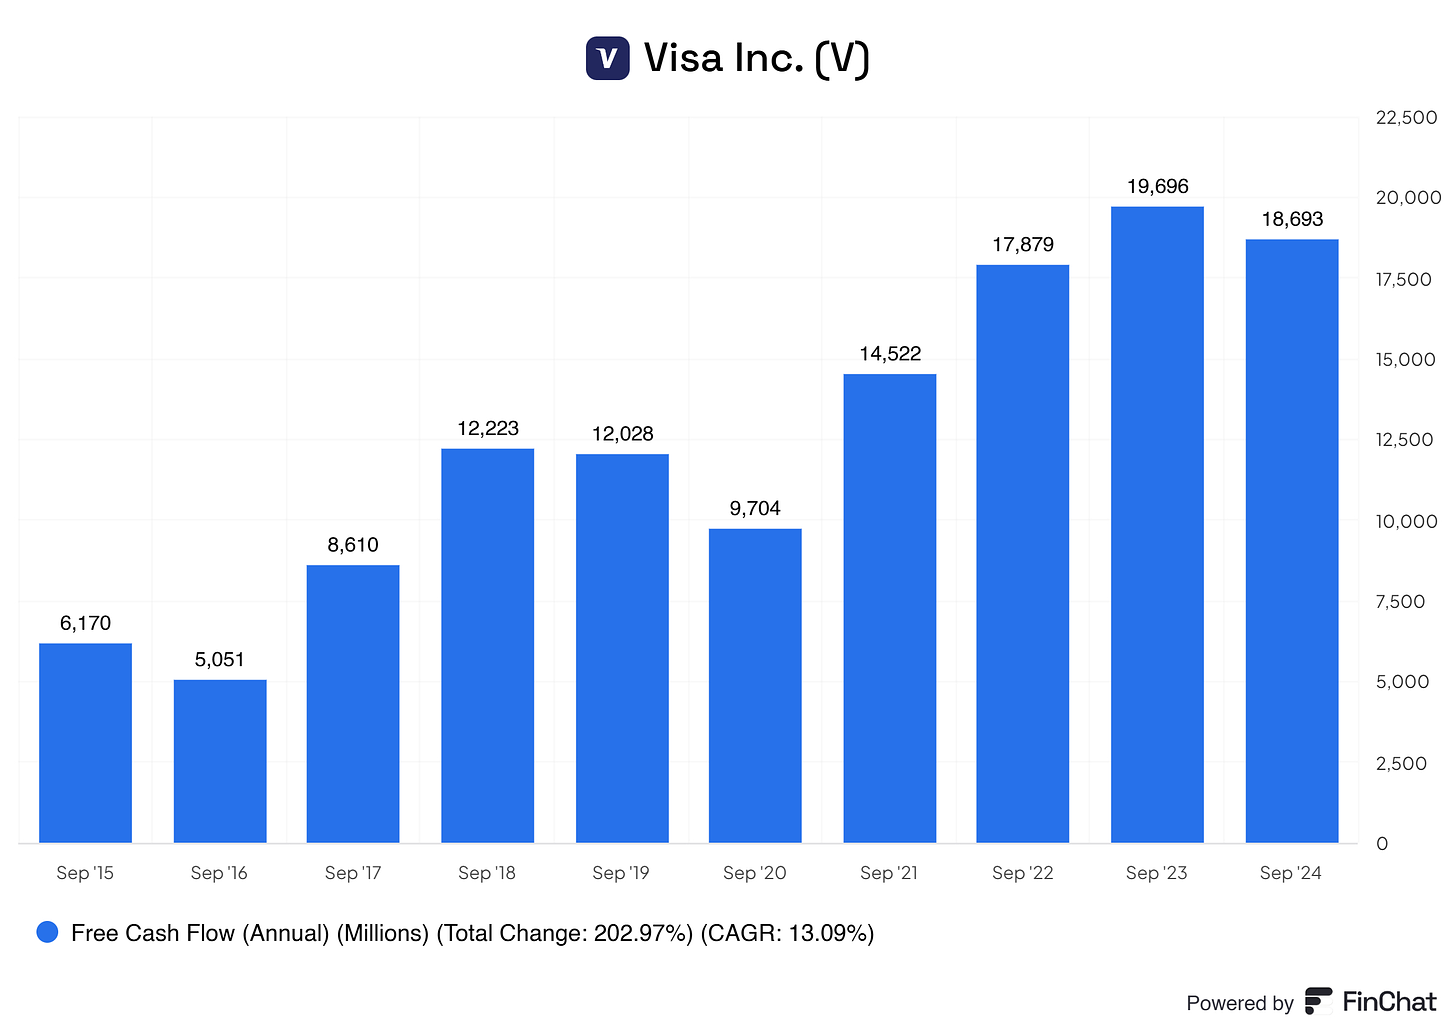
Visa’s free cash flow has grown substantially, increasing by 202.97% with a CAGR of 13.09%. This solid free cash flow generation is crucial, as it allows Visa to fund its operations, invest in expansion, and return value to shareholders through dividends and buybacks. The company’s ability to produce such high levels of free cash flow speaks to the strength and sustainability of its business model
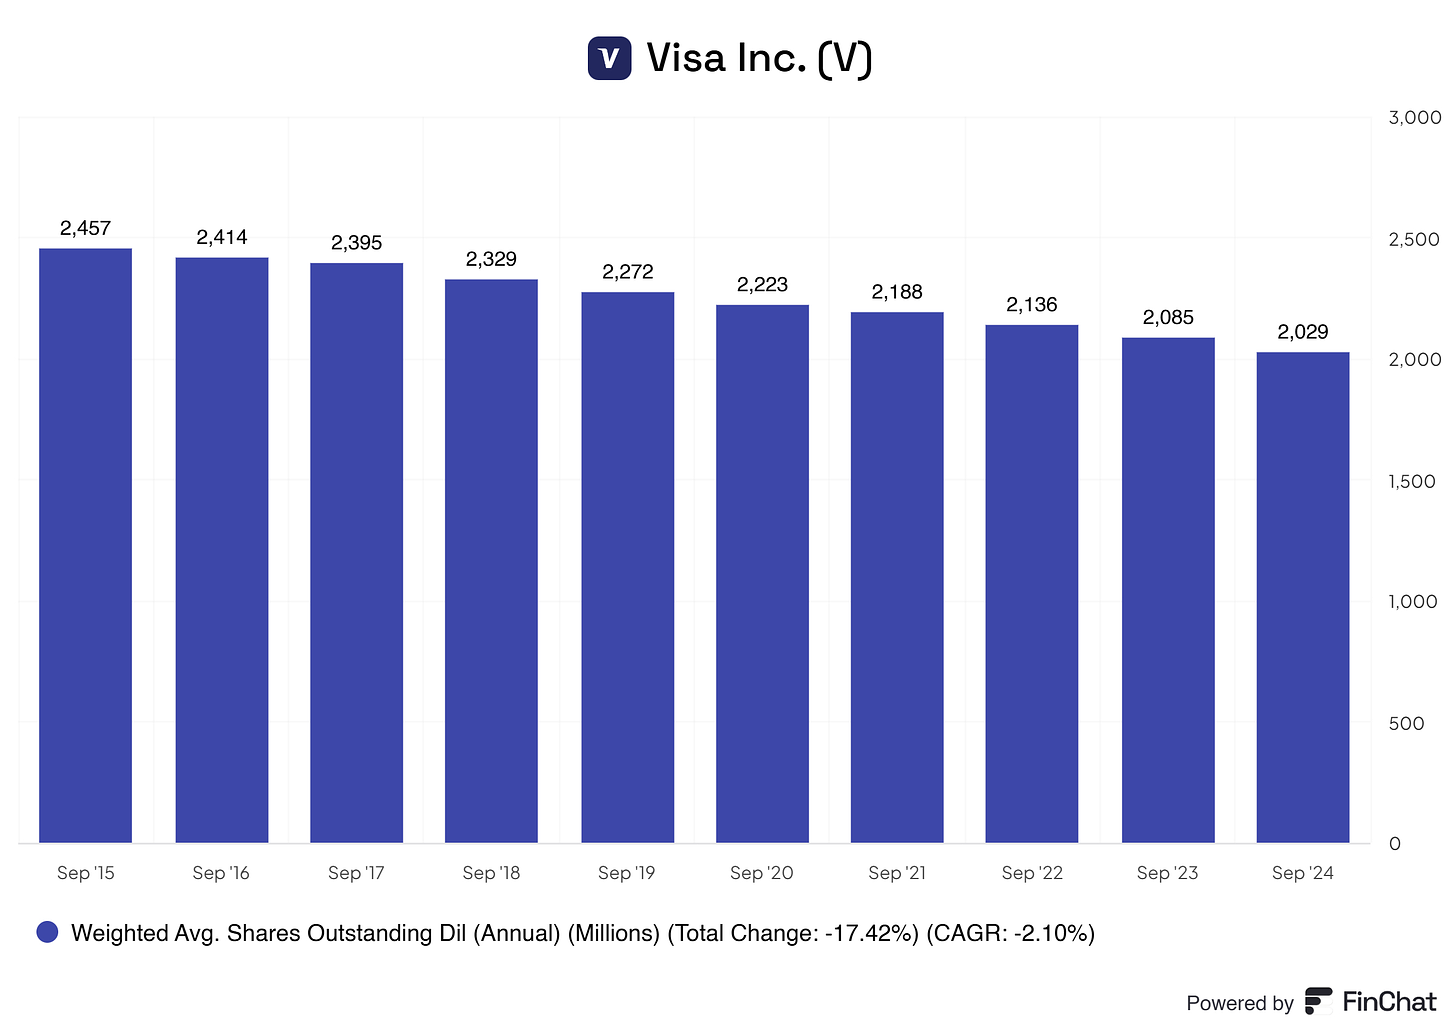
Finally, Visa’s share count has been steadily decreasing, with a 17.42% reduction in its weighted average shares outstanding, translating to a CAGR of -2.10%. This trend of share buybacks is a positive signal for investors, as it increases each shareholder's ownership stake and reflects Visa’s confidence in its long-term growth potential.
In summary, Visa’s financial performance showcases a company that is capital-efficient, highly profitable, and committed to shareholder value. The combination of solid return metrics, robust profit margins, diversified revenue growth, impressive free cash flow generation, and a shareholder-friendly buyback program makes Visa an attractive choice for any investor seeking long-term growth and stability in their portfolio.
Valuation
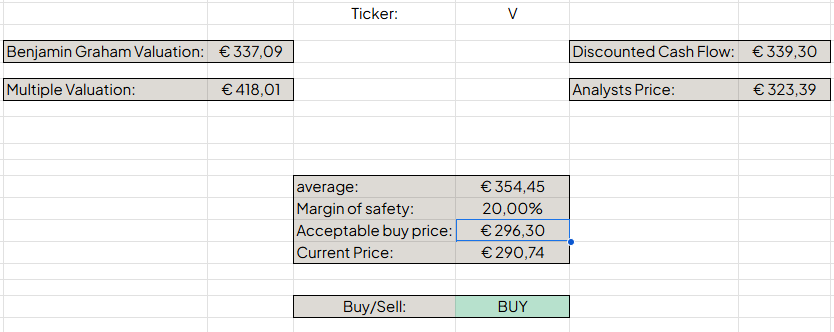
Multiple valuation: $418,01
Benjamin Graham's valuation: $337,09
Discounted Cash Flow valuation: $339,30
Analysts Price Target: $323,39
This comes down to a average of $354,45 per share for Visa. Currently, Visa is trading at $290,74 per share. That means we can buy Visa with a margin of safety of roughly 20%!
End note
Thank you for reading!
Please note that anything I write about on all my platforms should not be considered investment advice. These are my humble opinions, and you should always research before making any decision, especially regarding investments. Please read the full disclaimer below.
Disclaimer
I do own Visa shares and I do intend on buying more shares in the next six months.
By reading my posts, being subscribed, following me, and visiting my Substack, in general, you agree to my disclaimer. You can read the disclaimer here.



What made you go for V instead of MA. I do understand both are great quality businesses.